Hello @geofan,
your issue is probably related to Better support of non-ASCII characters in PyGMT arguments · Issue #2204 · GenericMappingTools/pygmt (github.com).
Beside using the corresponding octal code (\260, please not the addional \ in the code example below), you can plot the degree symbol in GMT / PyGMT using @.
Code example:
import pygmt

fig = pygmt.Figure()

fig.basemap(
    region=[-1, 1, -1, 1],
    projection="X2c",
    frame="a1f0.5g1",
)

fig.text(
    text="42\\260",  # using octal code, please not the addional "\"
    # text="42@.",
    x=0,
    y=0,
)

fig.show()
#fig.savefig(fname="degree_sign_gmt.png")
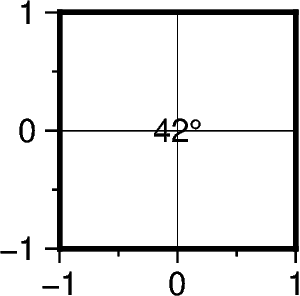
Output figure: