Hi everyone,
First of all I am new to PyGMT. So far I am playing with it and enjoying. I am using the version ‘v0.6.1’ in Ubuntu 22.04 LTS.
I have been trying to make a study area map with a DEM/Hillshade in the background and several polygons on top to show some boundaries, glacier outlines, and some other footprints, etc.
Everything goes fine, but when I include (using fig.plot()) a large polygon file (glacier outline from RGI/SAW; ~60 MB; contains ~28,000 individual polygons in it) within the figure cell (in Jupyter), it fails to render/show the figure. Neither it shows up nor it saves the figure.
The error message shows:
GMTCLibError: Module 'psconvert' failed with status code 79:
psconvert [ERROR]: System call [gs -q -dNOSAFER -dNOPAUSE -dBATCH -sDEVICE=bbox -DPSL_no_pagefill -dMaxBitmap=2147483647 -dUseFastColor=true '/home/icwar/.gmt/sessions/gmt_session.130176/gmt_11.ps-' 2> '/home/icwar/.gmt/sessions/gmt_session.130176/psconvert_130176c.bb'] returned error 256.
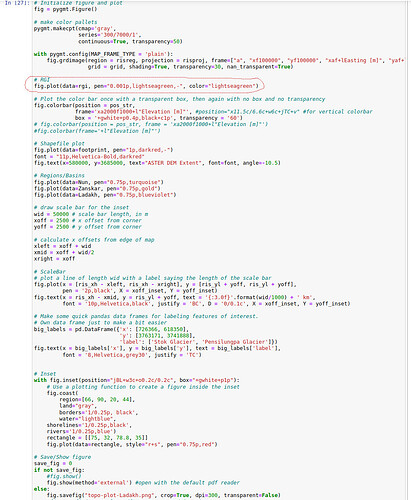
Below I attached a screenshot of the code (because there are several lines), with that large polygon (~60 MB with 28000 polygons) plotting line marked in red color.
If I remove the line (marked in red), the code renders everything smoothly, but it fails when I include it.
Below I provided the details of the PyGMT environment in my machine by running
python -c "import pygmt; pygmt.show_versions()"
PyGMT information:
  version: v0.6.1
System information:
  python: 3.9.13 | packaged by conda-forge | (main, May 27 2022, 16:56:21)  [GCC 10.3.0]
  executable: /home/icwar/anaconda3/envs/pygmt/bin/python
  machine: Linux-5.15.0-37-generic-x86_64-with-glibc2.35
Dependency information:
  numpy: 1.23.0
  pandas: 1.4.3
  xarray: 2022.3.0
  netCDF4: 1.5.8
  packaging: 21.3
  geopandas: 0.11.0
  ghostscript: 9.54.0
  gmt: 6.4.0
GMT library information:
  binary dir: /home/icwar/anaconda3/envs/pygmt/bin
  cores: 16
  grid layout: rows
  library path: /home/icwar/anaconda3/envs/pygmt/lib/libgmt.so
  padding: 2
  plugin dir: /home/icwar/anaconda3/envs/pygmt/lib/gmt/plugins
  share dir: /home/icwar/anaconda3/envs/pygmt/share/gmt
  version: 6.4.0
I hope I could write/present my concern properly so that one can understand and guide me.
I would be thankful if anyone can guide me to solve this issue.
Many thanks, Arindan.
Is it possible that the shp file is too big so it takes more time to plot?
Hi,
thanks for commenting.
I am not sure for that.
In that case what could be the solution to plot the shp file?
Do you have any suggestion?
Thanks, Arindan
Can you share with us your shp file so that we can give it a try?
Hi,
thanks.
Yes I can share it. Here is the link you can download the file: https://easyupload.io/2d16ah
Just for your info, I tried to plot this shp only (below code), it still shows the same error message.
rgi = gpd.read_file('that shp file path')
fig = pygmt.Figure()
fig.plot(data=rgi, pen="0.001p,lightseagreen,-", color="lightseagreen", frame=['a'])
fig.show()
The error message:
Error: /rangecheck in --setdash--
Operand stack:
   --nostringval--   0
Execution stack:
   %interp_exit   .runexec2   --nostringval--   setdash   --nostringval--   2   %stopped_push   --nostringval--   setdash   setdash   false   1   %stopped_push   1974   1   3   %oparray_pop   1973   1   3   %oparray_pop   1961   1   3   %oparray_pop   1817   1   3   %oparray_pop   --nostringval--   %errorexec_pop   .runexec2   --nostringval--   setdash   --nostringval--   2   %stopped_push   --nostringval--   1818   2   4   %oparray_pop
Dictionary stack:
   --dict:735/1123(ro)(G)--   --dict:0/20(G)--   --dict:75/200(L)--   --dict:157/250(L)--
Current allocation mode is local
Last OS error: No such file or directory
Current file position is 21540
GMTCLibError: Module 'psconvert' failed with status code 79:
psconvert [ERROR]: System call [gs -q -dNOSAFER -dNOPAUSE -dBATCH -sDEVICE=bbox -DPSL_no_pagefill -dMaxBitmap=2147483647 -dUseFastColor=true '/home/icwar/.gmt/sessions/gmt_session.13875/gmt_5.ps-' 2> '/home/icwar/.gmt/sessions/gmt_session.13875/psconvert_13875c.bb'] returned error 256.
Thank you.
That error means the PostScript file was created but is (for some reason) corrupted.
Note: I can plot the file with GMT.jl
1 Like
I also see the same error using pure GMT command:
gmt plot rgi_SAW_utm.shp -Baf -W0.001p,lightseagreen,- -Glightseagreen -pdf map
1 Like
While it is unclear why, our PSL library writes this line out once:
[0 0] 0 B
instead of
[] 0 B
(this is to turn off the dashed line). I have seen this sort of thing before and thought I had it fixed (I think it was [0] 0 B at that point). So will see if I can prevent this from happening (again). It only happens in combination of paint and dashed outline. A temporary workaround would be not to use the dashed outline.
Ah, that explains why I didn’t get an error in Julia and that’s because it was a quick plot that used the default line width, not a dashed 0.001p.
But, @arindan, with 26,000 polygons none of those details will be seen. 26 k is just too many polygons to put in a (non-wall) canvas.
1 Like
The bug has been fixed in the master repo. But as @Joaquim said, unless you are building a poster map for a meeting you are selecting pens that are ridiculously small…
1 Like
Dear everyone,
Thanks for getting involved in this issue.
That means the issue is more related to the line-width of the polygon boundaries ( pen="0.001p).
Following this I tried to plot with a higher size (pen="0.05p), it did plot the figure with all polygons.
