Hi @Phd.Yin,
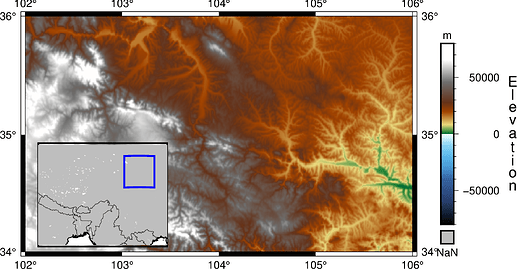
Thanks for trying out PyGMT! So the reason you have some blank space in your inset is because you set a square 5cm region when using fig.inset(position="jBL+w5c"), but your region in fig.coast(region=[80,110,20,40] is a rectangle.
To fix your problem, I would suggest 1) change the inset size to be rectangular using position="jBL+w5c/4c, and 2) Change the inset coast projection size to be automatic using `projection=“M?”.
with fig.inset(position="jBL+w5c/4c+o0.5c/0.2c", box="+pblack"):
    # Use a plotting function to create a figure inside the inset
    fig.coast(
        region=[80,110,20,40],
        projection="M?",
        land="gray",
        borders=[1, 2],
        shorelines="1/thin",
        water="white",
        # Use dcw to selectively highlight an area
        # dcw="US.MA+gred",
    )
    rectangle = [[100,32,107,38]]   #顺序不一样
    fig.plot(data=rectangle, style="r+s", pen="2p,blue")
I don’t have your mag data, but the plot should produce something like this:
Let us know if you need any more help ![]()
