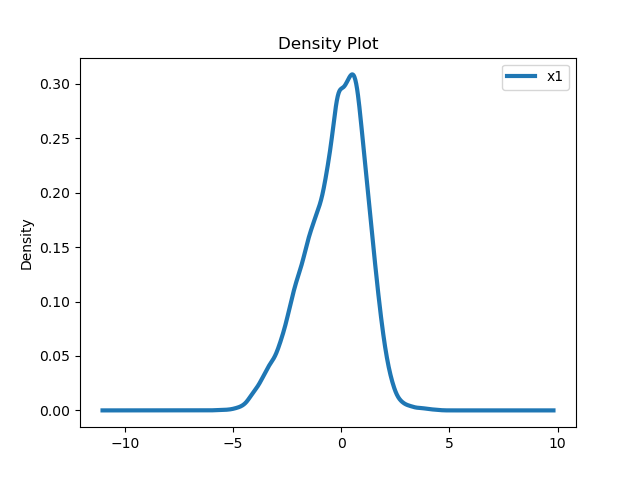
Hi everyone, I want to use the density map to count the pixel values in the image data, can pygmt plot the density map? As shown in the figure below:
The image data is as follows:
data.tif (156.7 KB)
Hi everyone, I want to use the density map to count the pixel values in the image data, can pygmt plot the density map? As shown in the figure below:
The image data is as follows:
data.tif (156.7 KB)