Hello,
I want to plot a symbol for a left-lateral fault using line fronts as indicated in this page: Line fronts — PyGMT
However, when I finally wrote the code for it, it doesn’t show in the map. Here is the script that I used:
import pygmt
fig = pygmt.Figure()
region = [116, 129, 4, 21.5]
#----------------------------setting up the map-----------------------------------------------#
fig.basemap(region=region, projection=“M15c”, frame=[“WSrt”,“a2”])
fig.coast(borders=[“1/1p”],shorelines=“0.5p,black”)
fig.basemap(rose=[“x5.5i/7i+w0.75i+l,N”],map_scale=[“x3.5i/0.3i+w200k+l”])
#-----------------------------fault symbol--------------------------------------#
fig.plot(x=[125.6],y=[10.5],style=“f5c/2c+l+s135”,pen=‘10p,black’)
fig.savefig(‘ph_region_test.png’)
Can anyone help me with this? Thank you.
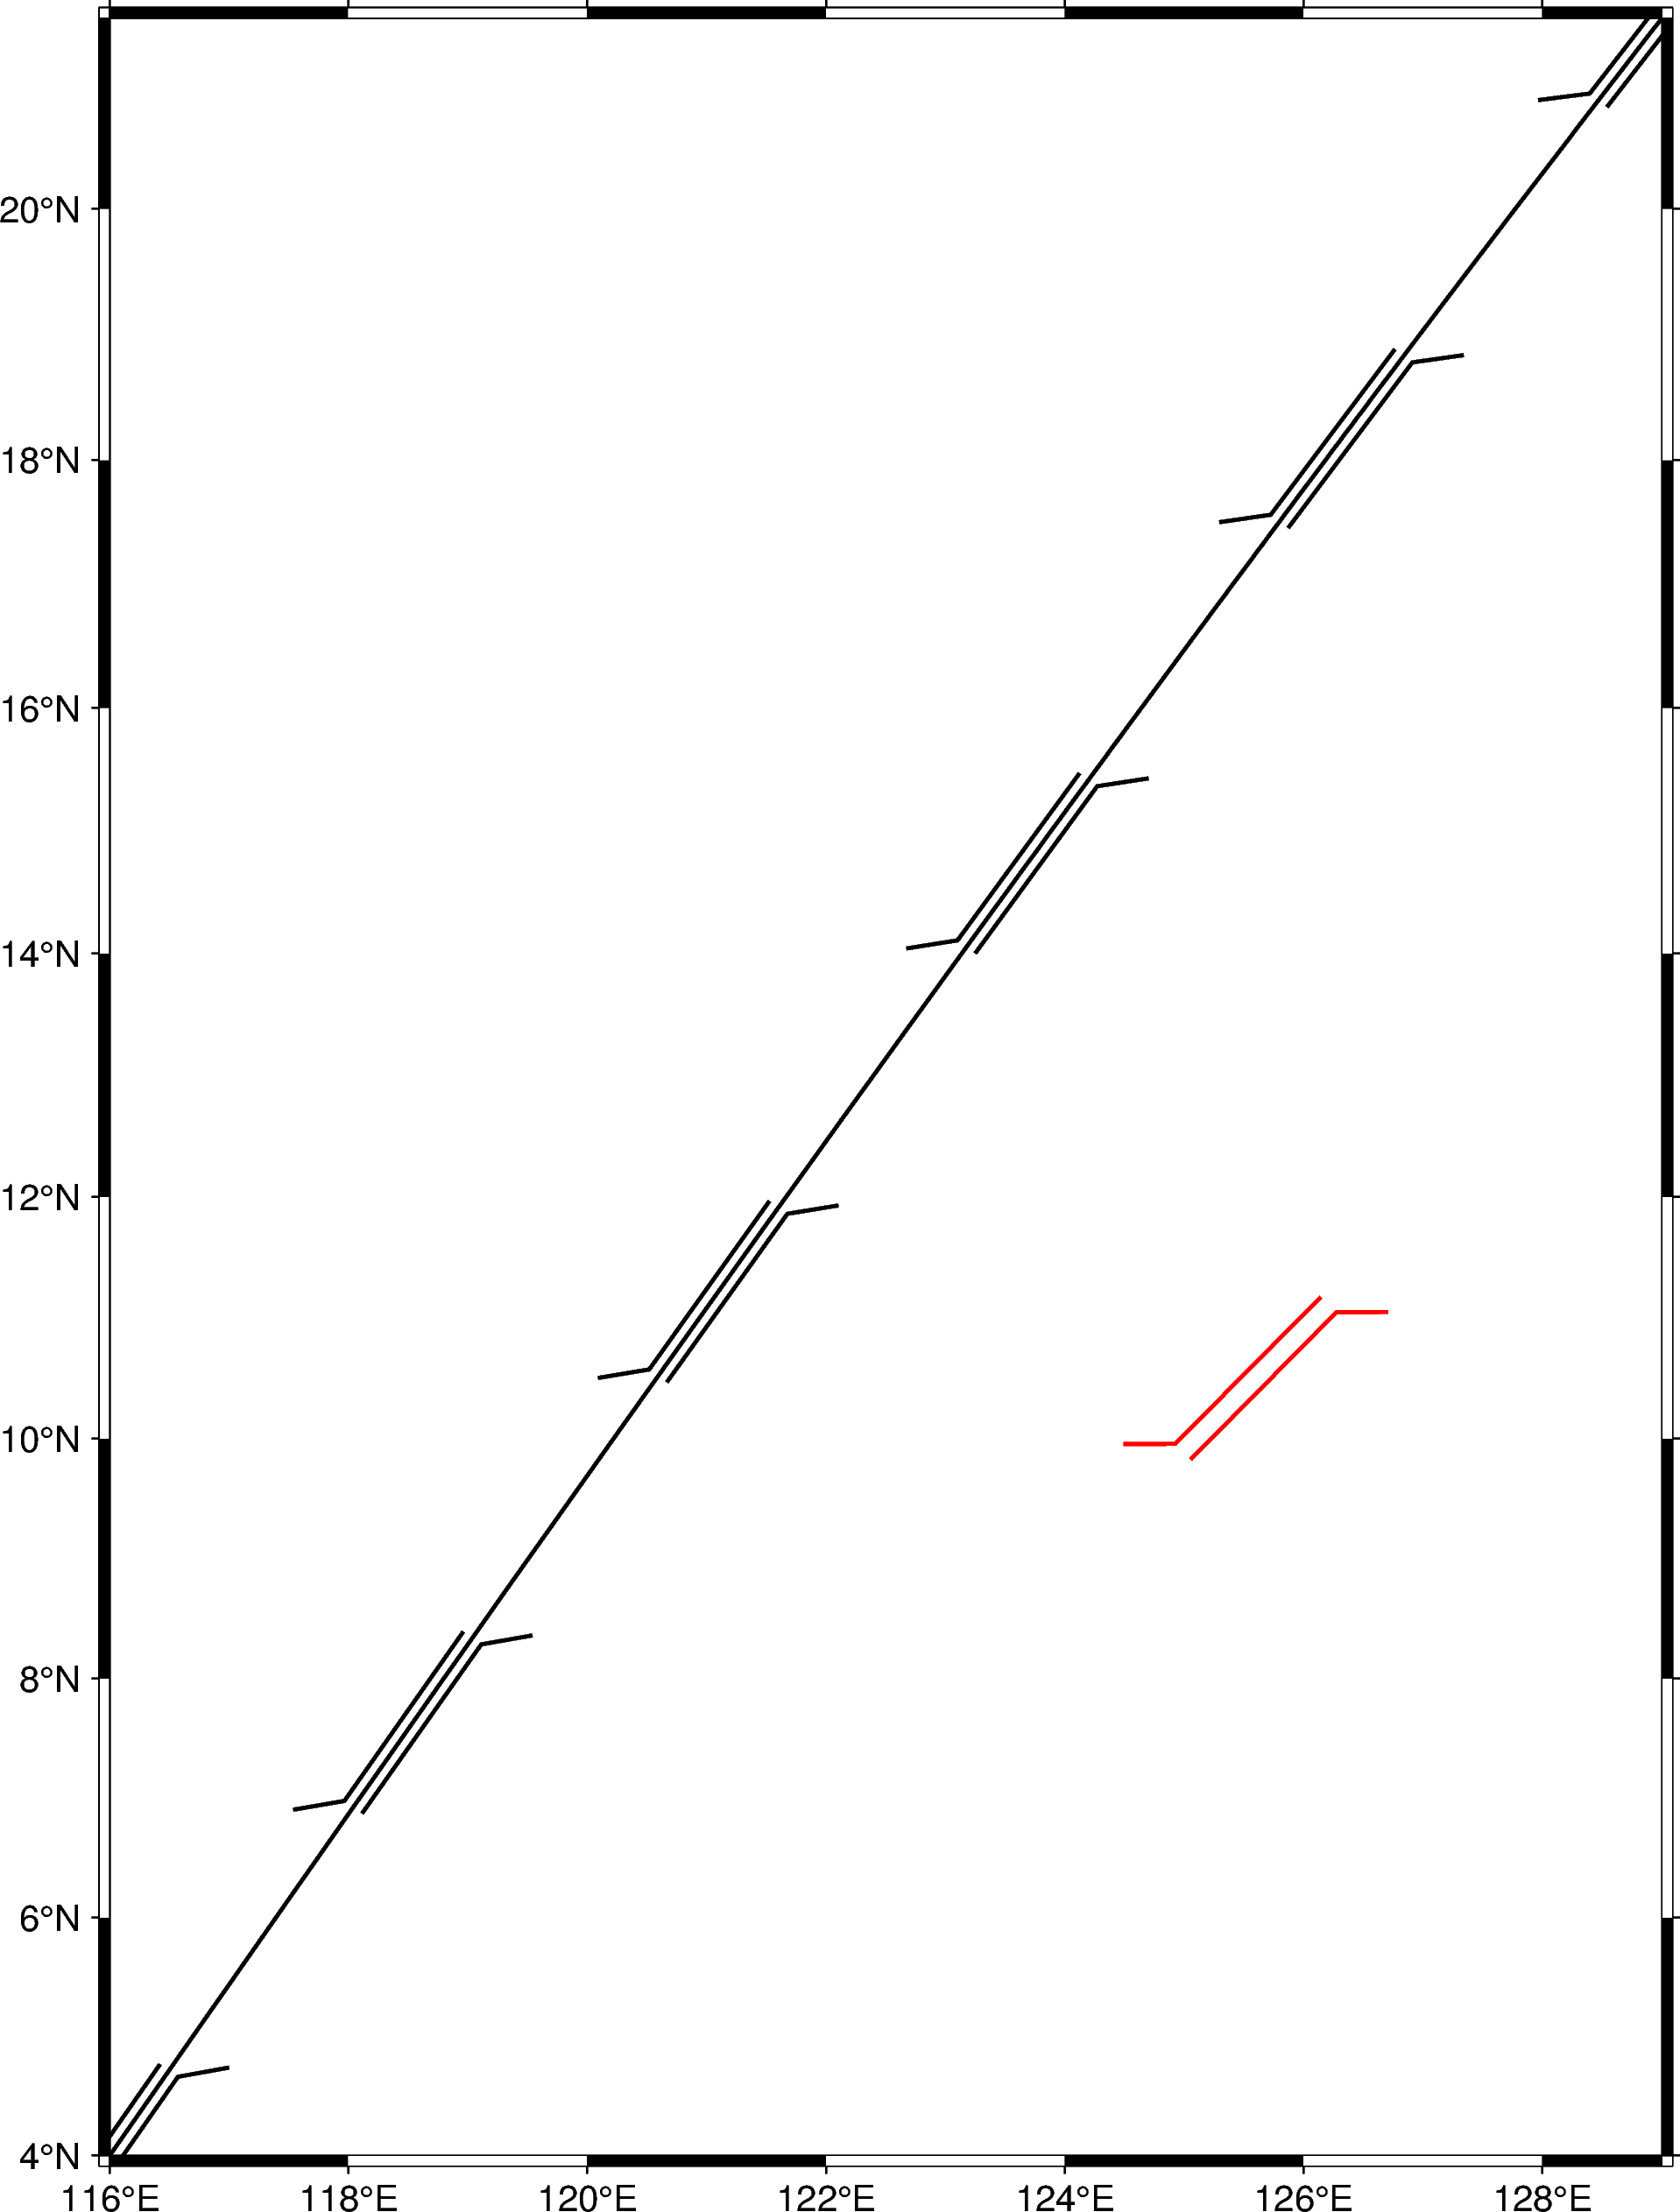
Hi @listwanites,
fig.plot(x=[125.6],y=[10.5],style=“f5c/2c+l+s135”,pen=‘10p,black’)
You have to give the start and end points of your line. Front symbols are plotted along a line. They are not like symbols plotted at specificed x and y coordinates.
import pygmt

fig = pygmt.Figure()
region = [116, 129, 4, 21.5]

#----------------------------setting up the map-----------------------------------------------#
fig.basemap(region=region, projection="M15c", frame=["WSrt","a2"])

#-----------------------------fault symbol--------------------------------------#
# fig.plot(x=[125.6],y=[10.5], style="f5c/2c+l+s135", pen="10p,black")
fig.plot(x=[116, 129], y=[4, 21.5], style="f5c/2c+l+s135", pen="1p,black")
fig.plot(x=[125.6, 125.60001], y=[10.5, 10.50001], style="f5c/2c+l+s135", pen="1p,red")

fig.show()
# fig.savefig(fname="ph_region_test.png")
It finally worked! Thanks, Yvonne!