Ok, it seems like PyGMT/GMT is unable to handle a mix of Polygon/MultiPolygon vector types in a single OGR file, which is the case for the updated naturalearth_lowres v5.0.1 dataset. I’ve submitted a bug report at Unable to handle GeoDataFrame with mixed Polygons/Multipolygons · Issue #2405 · GenericMappingTools/pygmt · GitHub to see if this can be fixed.
As a temporary workaround, you can use geopandas.GeoDataFrame.explode — GeoPandas 0.12.2+0.gefcb367.dirty documentation to convert all the MultiPolygons to Polygons (though this would need to be done carefully). Example code:
import pygmt
import geopandas as gpd
world = gpd.read_file(gpd.datasets.get_path('naturalearth_lowres'))
world.head()
# Calculate the populations in millions per capita
world = world[(world.pop_est>0) & (world.name!="Antarctica")]
world['pop_est'] = world.pop_est * 1e-6
# Find the range of data values for creating a colormap
cmap_bounds = pygmt.info(data=world['pop_est'], per_column=True)
cmap_bounds
# Create an instance of the pygmt.Figure class
fig = pygmt.Figure()
# Create a colormap for the figure
pygmt.makecpt(cmap="bilbao", series=cmap_bounds)
# Create a basemap
fig.basemap(region="d", projection="H15c", frame=True)
# Plot the GeoDataFrame
# - Use `close=True` to specify that the polygons should be forced closed
# - Plot the polygon outlines with a 1 point, black pen
# - Set that the color should be based on the `pop_est` using the `color, `cmap`, and `aspatial` parameters
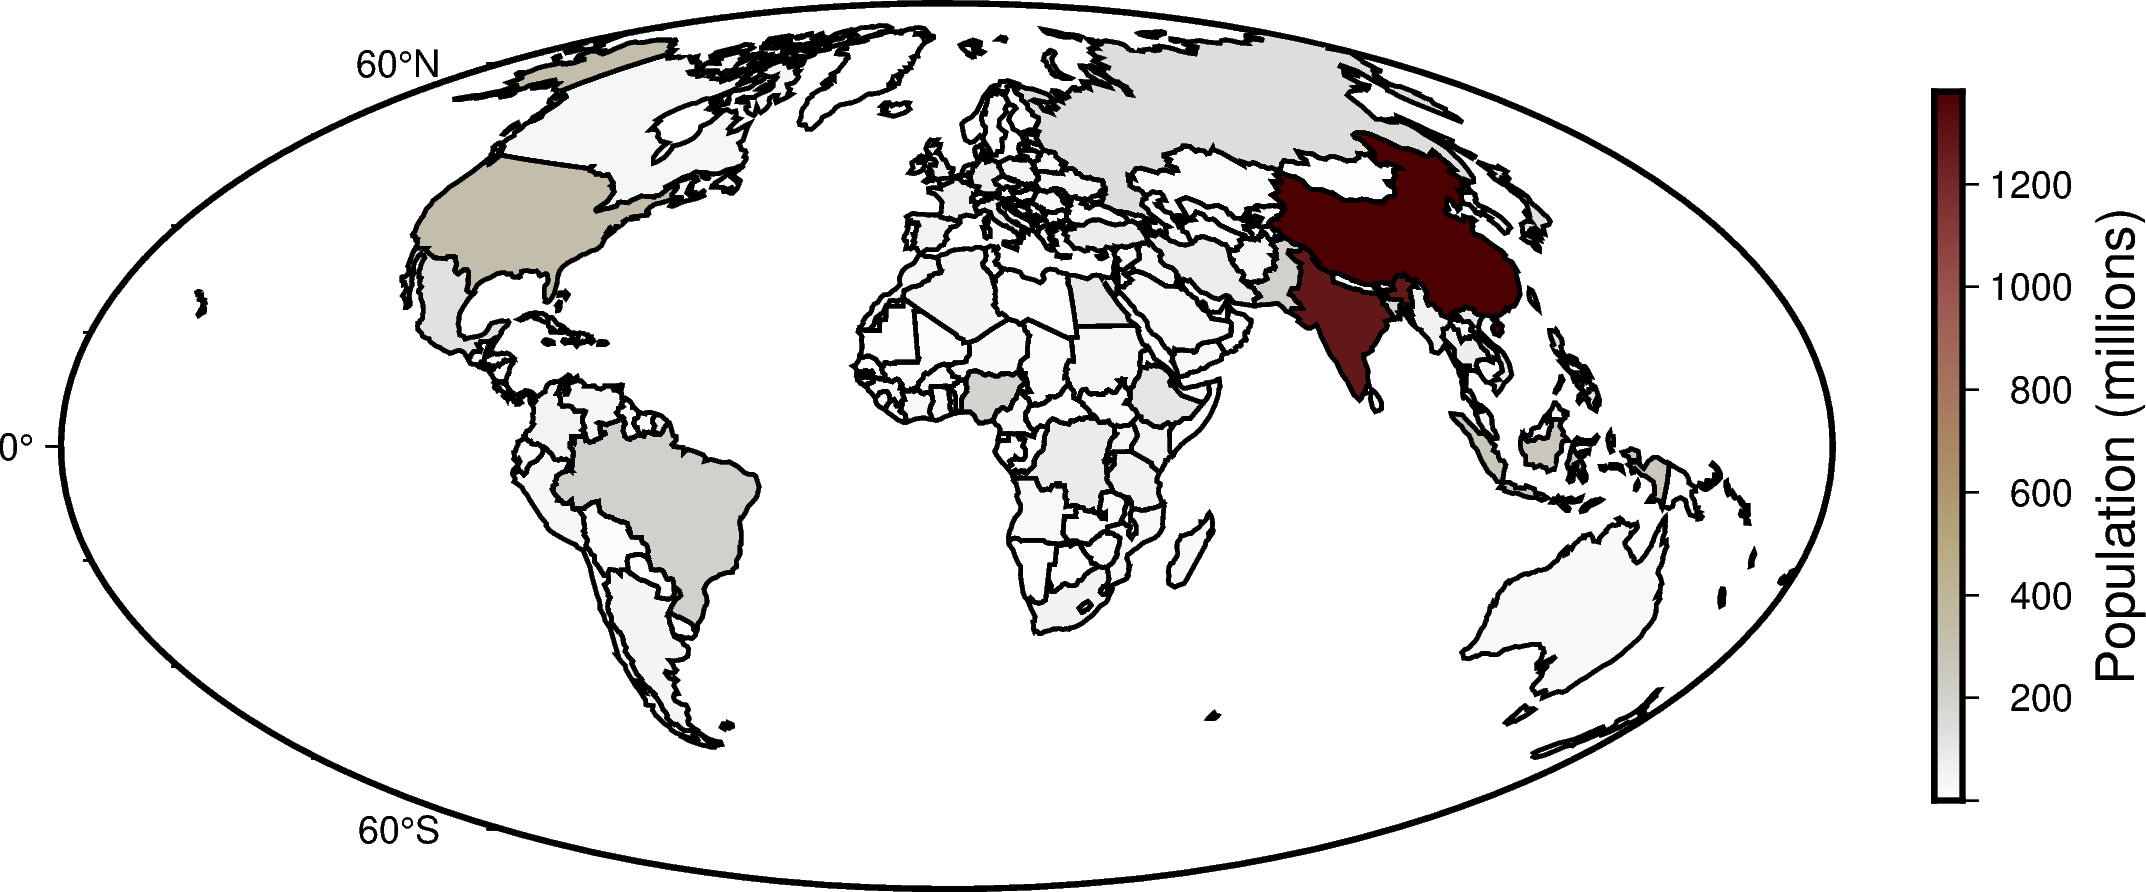
fig.plot(data=world.explode(ignore_index=True), pen="1p,black", close=True, color="+z", cmap=True, aspatial="Z=pop_est")
# Add a colorbar
fig.colorbar(position="JMR", frame='a200+lPopulation (millions)')
# Display the output
fig.show()
should produce: