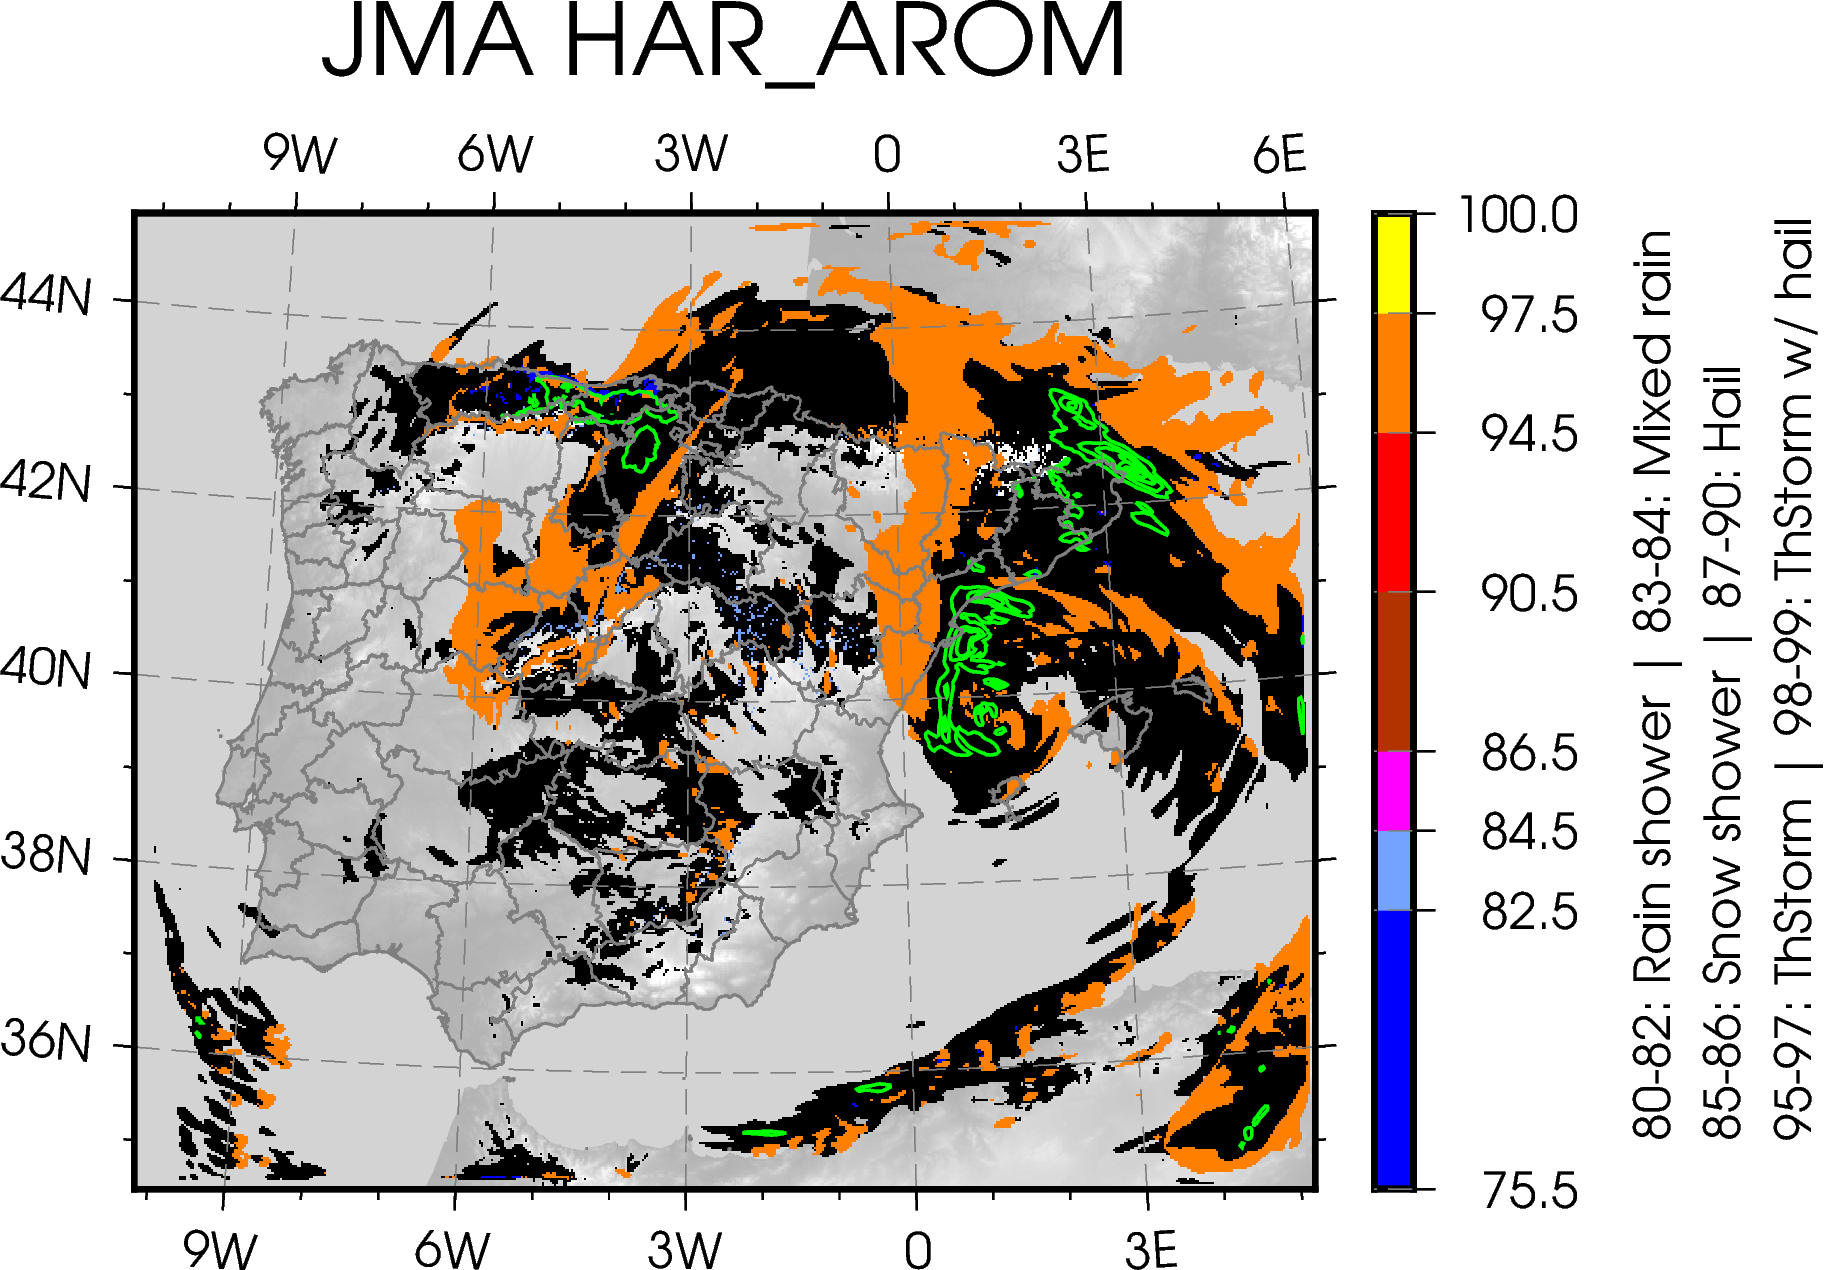
I’m creating a fairly complex figure with contours, various grids with transparencies, missing values, text… This is an example:
I’m using pygmt for the first time. The figure takes much longer than I expected. I tried to recreate the figure using CLI GMT, and indeed it takes about half the time. I want to use this for a time-critical application, therefore this lack of performance is problematic.
I was wondering if I’m doing anything wrong from Python, or if instead this lack of performance is something you cannot avoid and a price to pay for using the Python API.
I have left a simple, yet runnable example in this link. Running plot_class.sh takes about 3 seconds in my laptop, while running plot_class.py takes about 5 seconds, which is nearly 100 % more. Further, although it is a bit more difficult to explain, I noted that the time it takes to run with Python is variable: sometimes it takes longer, sometimes shorter.
Could it be a problem with the sessions, or some sort of leftover files left by Python? I do not fully understand this concept in the new version of GMT…? Do you think is there a way to overcome this overhead from Python, or instead this is how pygmt works and we can do nothing about it?