Solved my own issue.
hi_grd = pygmt.nearneighbor(x=np.ravel(lon_mask.values),
y=np.ravel(lat_mask.values),
z=np.ravel(hi_mask.values),
region=ext_plt,
spacing="15m",
search_radius="20m")
aice_grd = pygmt.nearneighbor(x=np.ravel(lon_mask.values),
y=np.ravel(lat_mask.values),
z=np.ravel(aice_mask.values),
region=ext_plt,
spacing="15m",
search_radius="20m")
proj = f"B{lonC:.1f}/{latC:.1f}/{ext_plt[2]:.1f}/{ext_plt[3]:.1f}/20c"
fig = pygmt.Figure()
fig.coast(projection=proj, region=ext_plt, land="white", water="black", frame="a")
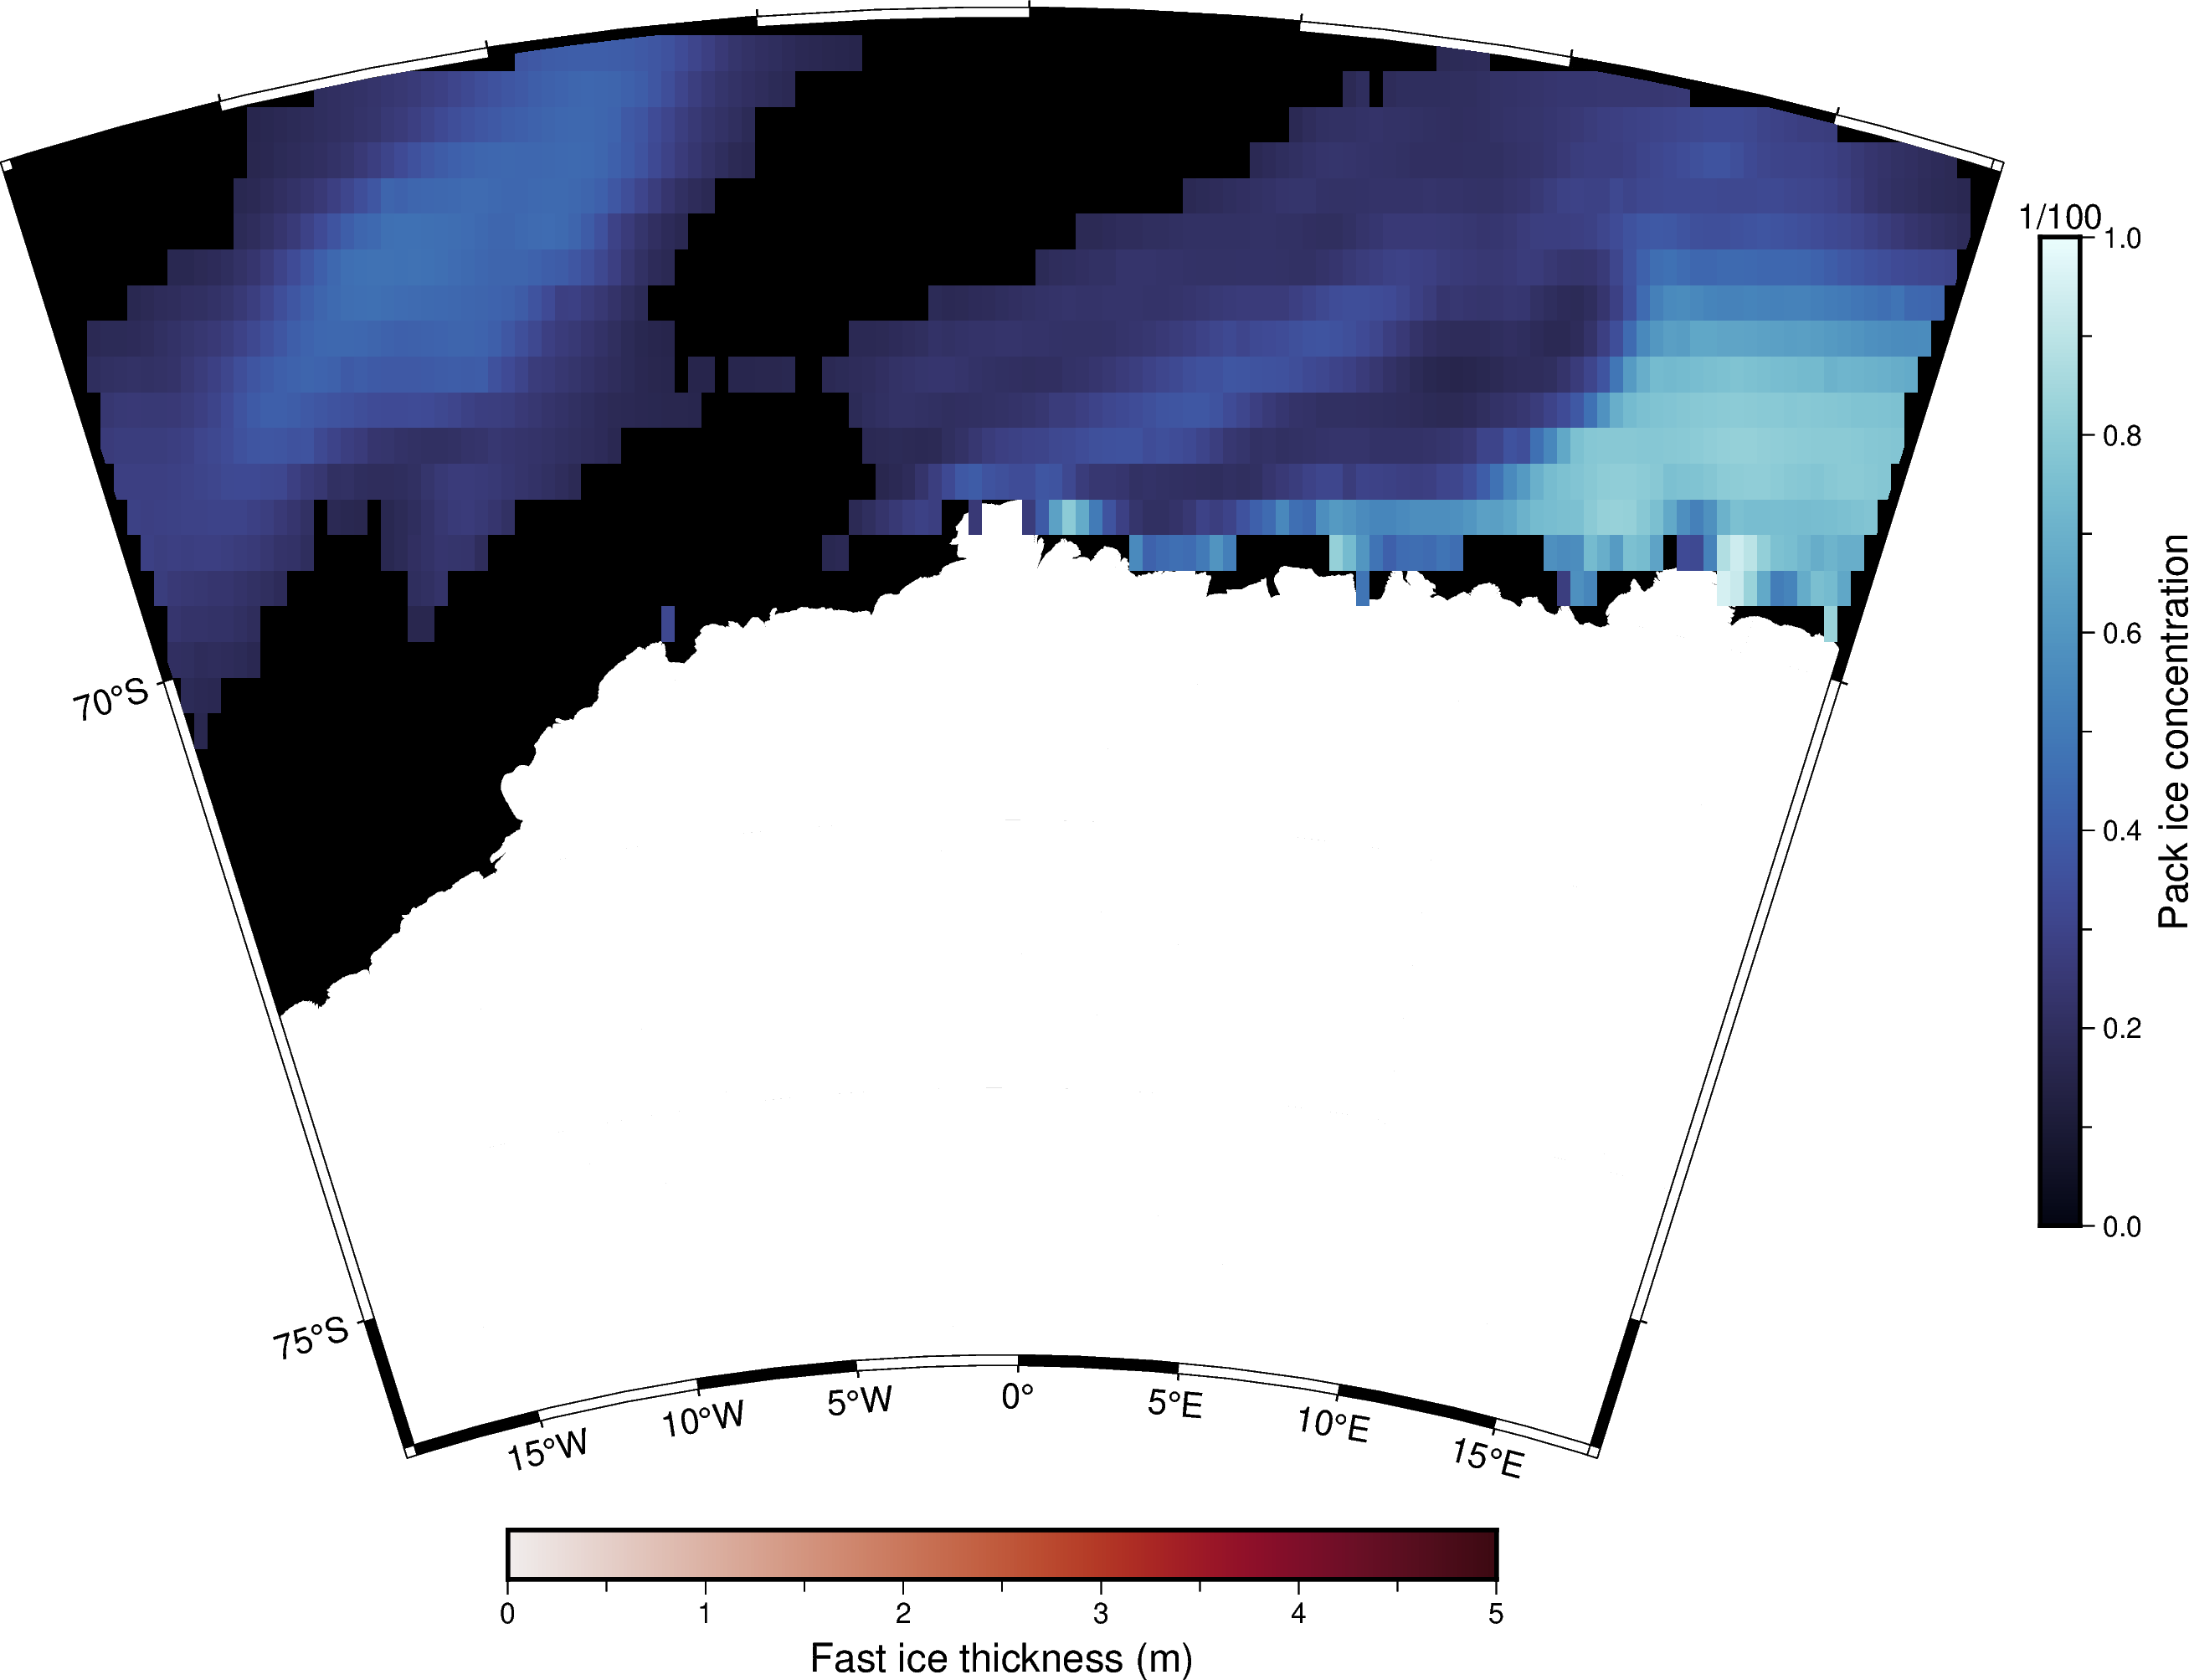
pygmt.makecpt(cmap="cmocean/ice", series=[0,1])
fig.grdimage(grid=aice_grd, cmap=True, nan_transparent=True)#, projection=proj, region=ext_plt)
fig.colorbar(frame=["x+lPack ice concentration", "y+l1/100"], position="JMR+o0.5c/0c+w10c")
pygmt.makecpt(cmap="cmocean/amp", series=[0,5])
fig.grdimage(grid=hi_grd, cmap=True, nan_transparent=True)#, projection=proj, region=ext_plt)
fig.colorbar(frame="a1f.5+lFast ice thickness (m)", position="JBC+w10c/0.5c+mc+h")
fig.show()
fig.savefig(P_save)