Shapefile to gmt (python)

The answer depends a lot on how the ‘lines’ in your shapefile are stored as, are they single linestrings, or multilinestrings? Or are they stored as a feature collection? Might be best if you can provide a sample of your ‘fault.shp’ file (including the .shx and .dbf files) so we can examine it.

That said, what I usually do is to load the shapefile using geopandas first, convert the ‘lines’ to a numpy array of x and y coordinates, and have PyGMT plot that. The code below should help to get you started:

import geopandas as gpd
import pygmt

# Load data from shapefile and convert to numpy array
gdf = gpd.read_file(filename="fault.shp")
linestrings = [geom for geom in gdf.geometry]

# Plot in PyGMT
fig = pygmt.Figure()
for line in linestrings:
    x, y = line.coords.xy
    fig.plot(x=x, y=y, pen="thin")
fig.show()
2 Likes

Hello I have used a library in python called geopandas this library can be use to read different geospatial file formats ( such as shapefile, geoJSON, KML, etc). There is a mini course in kaggle https://www.kaggle.com/learn/geospatial-analysis that is easy to follow.

1 Like

Hello I tried your code but I get this error:
Traceback (most recent call last):

File “C:\Users\Maureen\Documents\M1 Stage\GMT\fault-map.py”, line 26, in
x, y = line.coords.xy

AttributeError: ‘NoneType’ object has no attribute ‘coords’

I would like to provide my files but I can’t upload them the format isn’t supported…

You can either make it available somewhere or, if not big, zip the files and attach them here.

Failles.zip (37.9 KB)
Did it work?

Yes, but …
The shapefile does not seem to be very healthy (and you didn’t try my previous suggestions)

This complains and only output a couple of segments.

ogr2ogr -f gmt failles.gmt failles.shp
Warning 1: The output driver does not seem to natively support Integer64 type for field id. Converting it to Real instead. -mapFieldType can be used to control field type conversion.
ERROR 1: Features without geometry not supported by GMT writer.
ERROR 1: Unable to write feature 3 from layer failles.
ERROR 1: Terminating translation prematurely after failed
translation of layer failles (use -skipfailures to skip errors)

This complains but converts

gmtconvert Failles.shp > failles.dat
ERROR 1: Features without geometry not supported by GMT writer.

and Julia ofc also complain but works.

plot("failles.shp", savefig="failles.png", show=true,)

and in python with julia it works too but very picky with the path. It doesn’t accept back slashes.

python
Python 3.7.2 (tags/v3.7.2:9a3ffc0492, Dec 23 2018, 23:09:28) [MSC v.1916 64 bit (AMD64)] on win32
Type "help", "copyright", "credits" or "license" for more information.
>>> from julia import GMT
>>> GMT.plot("c:/v/Failles.shp", savefig="failles.png", show=True)
ERROR 1: Features without geometry not supported by GMT writer.

I’m having trouble using pyjulia (not very skilled with computers) that’s why I couldn’t use your method with julia when I try to import GMT I get this error :Traceback (most recent call last):

File “C:\Users\Maureen\Documents\M1 Stage\GMT\sanstitre0.py”, line 8, in
from julia import GMT

File “”, line 991, in _find_and_load

File “”, line 975, in _find_and_load_unlocked

File “”, line 655, in _load_unlocked

File “”, line 618, in _load_backward_compatible

File “C:\Users\Maureen\AppData\Roaming\Python\Python38\site-packages\julia\core.py”, line 248, in load_module
elif self.julia.isafunction(juliapath):

File “C:\Users\Maureen\AppData\Roaming\Python\Python38\site-packages\julia\core.py”, line 239, in julia
self.class.julia = julia = Julia()

File “C:\Users\Maureen\AppData\Roaming\Python\Python38\site-packages\julia\core.py”, line 468, in init
jlinfo = JuliaInfo.load(runtime)

File “C:\Users\Maureen\AppData\Roaming\Python\Python38\site-packages\julia\juliainfo.py”, line 68, in load
proc = subprocess.Popen(

File “C:\Users\Maureen\anaconda3\envs\pygmt\lib\site-packages\spyder_kernels\customize\spydercustomize.py”, line 105, in init
super(SubprocessPopen, self).init(*args, **kwargs)

File “C:\Users\Maureen\anaconda3\envs\pygmt\lib\subprocess.py”, line 854, in init
self._execute_child(args, executable, preexec_fn, close_fds,

File “C:\Users\Maureen\anaconda3\envs\pygmt\lib\subprocess.py”, line 1307, in _execute_child
hp, ht, pid, tid = _winapi.CreateProcess(executable, args,

FileNotFoundError: [WinError 2] Le fichier spécifié est introuvable

And I installed only pygmt not gmt and when I looked at the gmt install procedures for windows, I feel like I won’t be able to get to the end (it took me a lot of time just to make pygmt work). Also I’m reluctant to use another language while I’m still very weak in python, I started programming this year and python is a requirement for my Masters’ degree…
For the shapefile I don’t know why there’s a problem with it… I’ll ask someone whose better than me with QGIS why the .shp file is missing headers and if it’s possible to add those (I think it’s the reason why I can’t import it with pygmt)
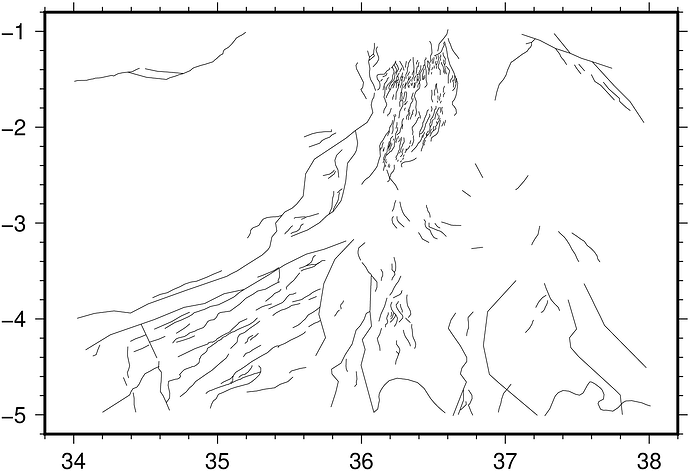
I can’t help you with Py-problems, but make you life easier. Use the gmtconvert command I showed you and next use the failles.dat in pygmt. Or even better, just use plain GMT on command line.

1 Like

Hi Saren,

as Joaquim has shown your shapefile is in ok shape - there’s a few empty geometries in there which is not much of a drama. Shapefiles are not actual files but as you (and others in the forum) have pointed out come as set of files. You will need at least the *.shp (the actual geometries), *.dbf (the metadata/attributes in dBase format) and .shx (index file) file. There can be more such as projection (.prj) etc. The individual files are almost exclusively binary.

The GMT format is ascii text and the OGR_GMT format is just a special way of encoding critical information from the shapefiles (including attributes and their data types) so that you can translate it forth and back between various other structured formats used in the GIS world. A lot of them require information on the CRS/projection, attributes etc to be present which is quite different to GMT which only requires two columns with xy info in the bare minimum case (no info about projection/attributes etc required).

Map making: you wrote earlier that you want to make a map with your fault lines and EQs. So you have some options here:

  1. Make the map in QGIS as you already have the faults in shp file format in QGIS you will only need to import the EQ data. You could do this in QGIS using the Layer dialogue using a comma separated text file (CSV) - not sure how your earthquake data is stored. GMT is of course a lot nicer :wink:

  2. Make the map in good old GMT using the windows shell - a *.bat file where you simply call gmt commands to make a map such as

    gmt begin
    gmt figure MyFaultsEQMap pdf,png
    gmt plot My_Earthquake_data <some plotting commands>
    gmt plot My_Faults <some plotting commands>
    gmt end

This will require to have you faults shapefile translated to GMT format - you can achieve this conversion using the line Joaquim posted above with ogr2ogr -F OGR_GMT as format option. ogr2ogr complains but this is because you have some empty features and some fields data types are not liked (no major dramas there). Once you have the ogr2ogr utility on your path (see e.g. here) you should be able to simply run this to generate a OGR_GMT file from your shapefile(s) which is a plain text file. ogr2ogr takes care about the geometries (point/polygons/lines) and also whether the geometries are multi* geometries - a multiline segment will be translated to a multi-line segment in GMT where all line segments carry the same attributes.

  1. make map using pygmt. The best bet here is to either read your fault.shp via the geopandas library like already mentioned by @weiji14 or @Joleonar or convert it using above ogr2ogr command and simply read it through. As you have empty geometries in there of course pygmt will complain that there are empty features (no coordinates), so you would need to put in a condition or clean your fault data set prior to reading it in (in QGIS maybe?).

Hope this helps,
Christian

1 Like

Ok thanks for your help and the time you spent solving my problem (I should have put more details in my initial message) I’m sure one day I will need to use plain GMT and use julia (since many people are using it too).

This fails (the Win GMT comes with a full GDAL, so ogr2ogr is ready to use). Again, use gmtconvert.

Hi thanks for your very detailed message, lots of notions are clearer now! My earthquake datas are in .txt format, they are separated from the fault data (and I successfully made a map with the arthquakes only) I imported those with pandas. I tried Weiji14 solution but I need to clean my fault data (something’s missing for the x and y coordinates, I don’t really know how to do it, I will study geopandas maybe I can give attribute to the coordinates with it? And if it doesn’t work I will ask someone with better skills in QGIS who can teach me how to do that)

Problem solved! Thank you all for your help!!! :grinning:
geopandas works just like pandas so I used the .dropna() function like so (in case someone needs it):

import pygmt
import geopandas as gpd

region = [36,37,-3,-1.8]
fig = pygmt.Figure()
# Load data from shapefile and convert to numpy array
gdf = gpd.read_file(filename="Failles.shp")
gdf1=gdf.dropna()
print(gdf1)

fig = pygmt.Figure()
fig.basemap(region=region, projection="M8i", frame=True)
fig.grdimage("@srtm_relief_03s", shading=True, cmap='geo')
fig.coast(rivers='a/0.5,skyblue', water='skyblue')
fig.coast(borders='1/1,black')
linestrings = [geom for geom in gdf1.geometry]
for line in linestrings:
    x, y = line.coords.xy
    fig.plot(x=x, y=y, pen="thin")
fig.savefig('test.png')

Just for the rec, same fig in Julia is created with :sunny:

grdimage("@srtm_relief_03s", region=[36,37,-3,-1.8], proj=:Mercator, shading=true, cmap=:geo)
coast!(borders=(type=1, pen=(1,:black)), rivers=(type=:a, pen=(0.5,:skyblue)), water="skyblue")
plot!("c:/v/failles.shp", savefig="failles.png", show=true)
1 Like

Wow that’s short and easily understandable, I see now why you chose julia over python :slightly_smiling_face:.

Ah - thanks @Joaquim, wasn’t aware that the Win GMT version ships with GDAL.

Great, glad to see you’ve worked it out. If you don’t mind, could you share your map (including code and data) over at the Showcase category? It will be really helpful for someone else in the future.

Also could do a Rosetta Stone of GMT/GMT.jl/PyGMT commands to do the same thing :slightly_smiling_face: