Hi !
I would like to make a 3D block with seismic lines to have a 3 view of my case study.
Is it possible to plot the seismic line’s grid (I used segy2grd before) to plot in a 3D view (with x,y, and TWT on axis)
I can also make 4 columns file (x, y, time, amp) but I can’t find a good function to plot it.
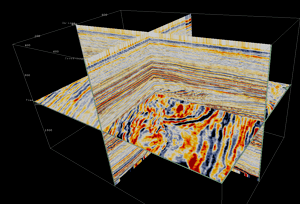
Here’s a example of what I would like to have