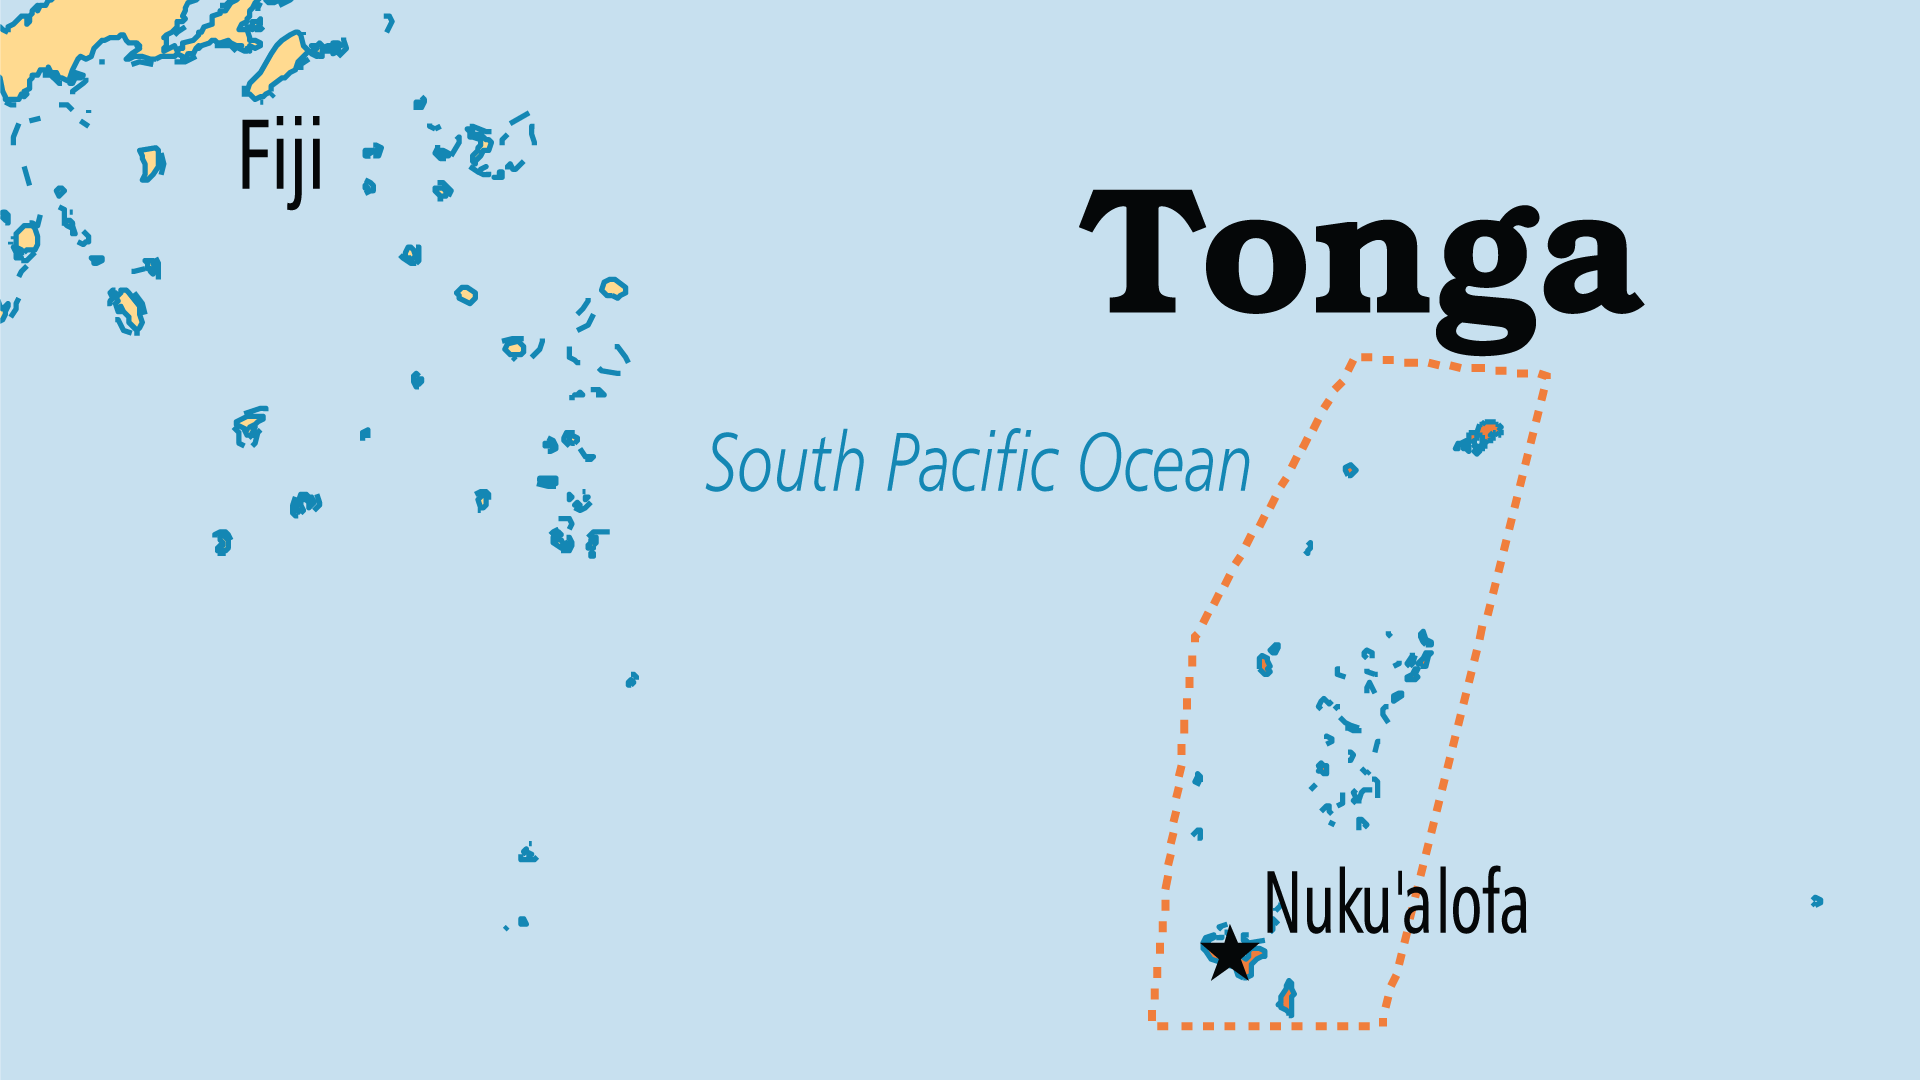
I am trying to plot a map of Tonga with minimal distortion - mainly just for fun. Tonga is a string of islands which lie in an almost straight line (with a few exceptions). The “line” for the islands is oriented about 25 degrees east of north, and passes through the main island. The following “normal” map illustrates this:
The standard map projection for Tonga is a Transverse Mercator projection: EPSG5887, which is pretty good, but I reckon an Oblique Mercator projection could do even better. The map’s equator needs to be rotated through 115 degrees from the Earth’s normal equator to achieve this. Here is my code:
#!/usr/bin/env bash
#
# Oblique Mercator projection for Tonga. Aim to minimise distortion for Tongatapu,
# Haʻapai and Vavaʻu island groups.
region=-177/-172/-23/-17
centre=175:12:2W/21:7:53S		# Royal palace, Nukuʻalofa.
azimuth=115
rotate1=$(bc -e "${azimuth} - 90")

gmt begin tonga png
	gmt set PROJ_ELLIPSOID GRS-80
	gmt set PROJ_SCALE_FACTOR 1
	gmt set MAP_GRID_PEN faint,black
	if [[ ! -f tonga_dem.nc ]]
	then
		gmt grdlandmask -Df -I3s/3s -R${region} -Gmask.nc
		gmt grdmath -R${region} mask.nc @earth_relief_03s DUP 0 GT MUL DUP 1 IFELSE \
			@earth_relief_03s DUP 0 LT MUL DUP -1 IFELSE IFELSE = tonga_dem.nc
	fi
	gmt grdimage tonga_dem.nc -JOA${centre}/${azimuth}/25 -Cetopo1 \
		-R-1/1/-0.4/3 -I
	gmt coast -Df -Wthinnest,black -BWSEN -Bpxf1a1g1 -Bpyf1a1g1 \
		-TmjLT+d13.99+w5c+l
	gmt project -C${centre} -A${rotate1} -G1d -L-180/180 | gmt plot -Wthin,80
gmt end

pngquant --ext .png --force tonga.png
open tonga.png
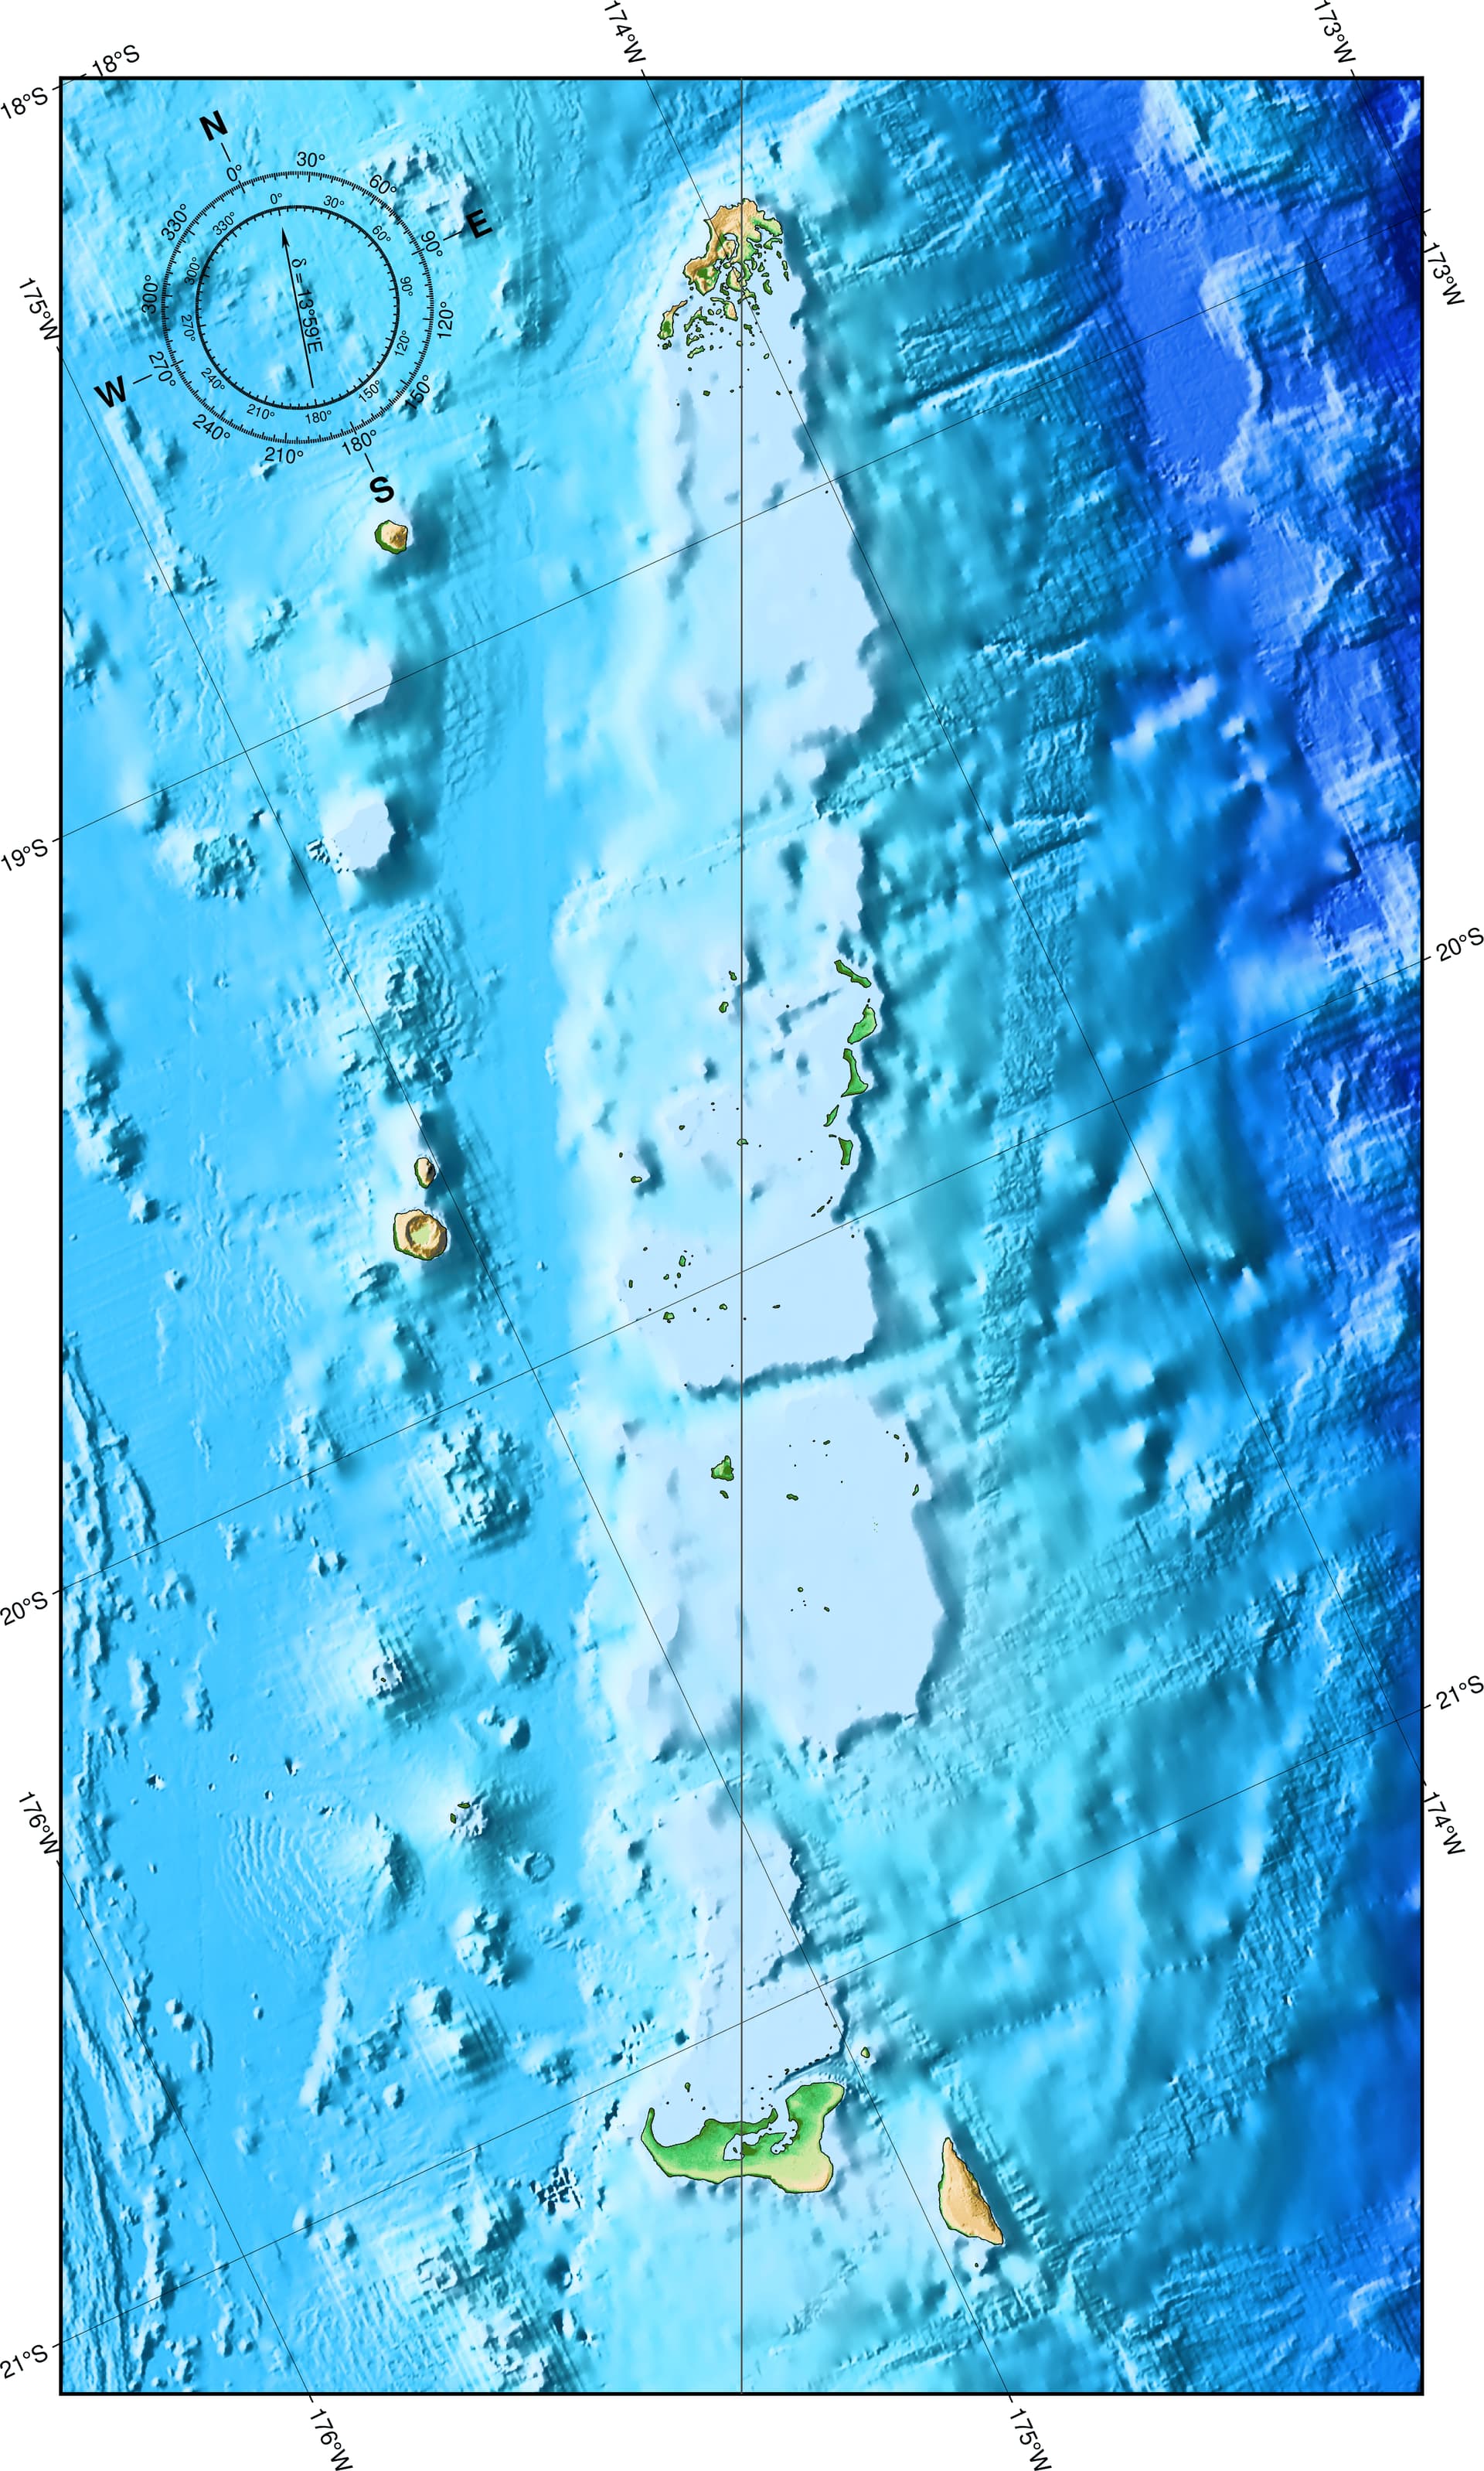
Note that -R behaves differently for Oblique Mercator. What I want is to rotate the map so that North points up. This is easy enough to do with the -p option. However, now my map looks like this:
I would like the rotated map to have data in the white patches so it looks like a vertical rectangle, not a rotated rectangle. But no matter how I adjust the -R option, I cannot achieve this. If -R for Oblique Mercator behaved like -R does for the all the other projections it would be doable. It’s the special -R behaviour which seems to be thwarting me.
Does anyone have any suggestions as to how I can get the map looking like a vertical rectangle instead of a rotated one, but still have the actual contents of the map rotated so North points upwards?
About the only thing I can think of is to project all my data (using grdproject etc) into Cartesian coordinates, rotate these somehow, and then plot these using -Jx.
esp how -R is specified: in kilometers for NZ, or as oblique lon/lat for California -RLL_lon/LL_lat/UR_lon/UR_lat+r. (LL = lower left, UR=upper right).
another interesting thing is rotation, NZ is horizontal, California is vertical using -J...+v
you can also plot your rectangular region to visualize what the region looks like on a Mercator map, using gmt mapproject JOA${centre}/${azimuth}/25 -R-1/1/-0.4/3 -We+n2 | gmt plot -J... -R... -png quick. -We+n2 produces that red rectangle, one needs two points per the rectangle side, like on the figure in `mapproject documentation, left panel mapproject — GMT 6.5.0 documentation
oblique Mercator is a lot fun but not intuitively understandable for me.
Thanks @mkononets it seems that there are only two options for orienting Oblique Mercator - either have the oblique equator parallel to the x axis (default), or the y-axis (+v modifier). What I want is an arbitrary rotation.
Looks like I’ll have to experiment more.
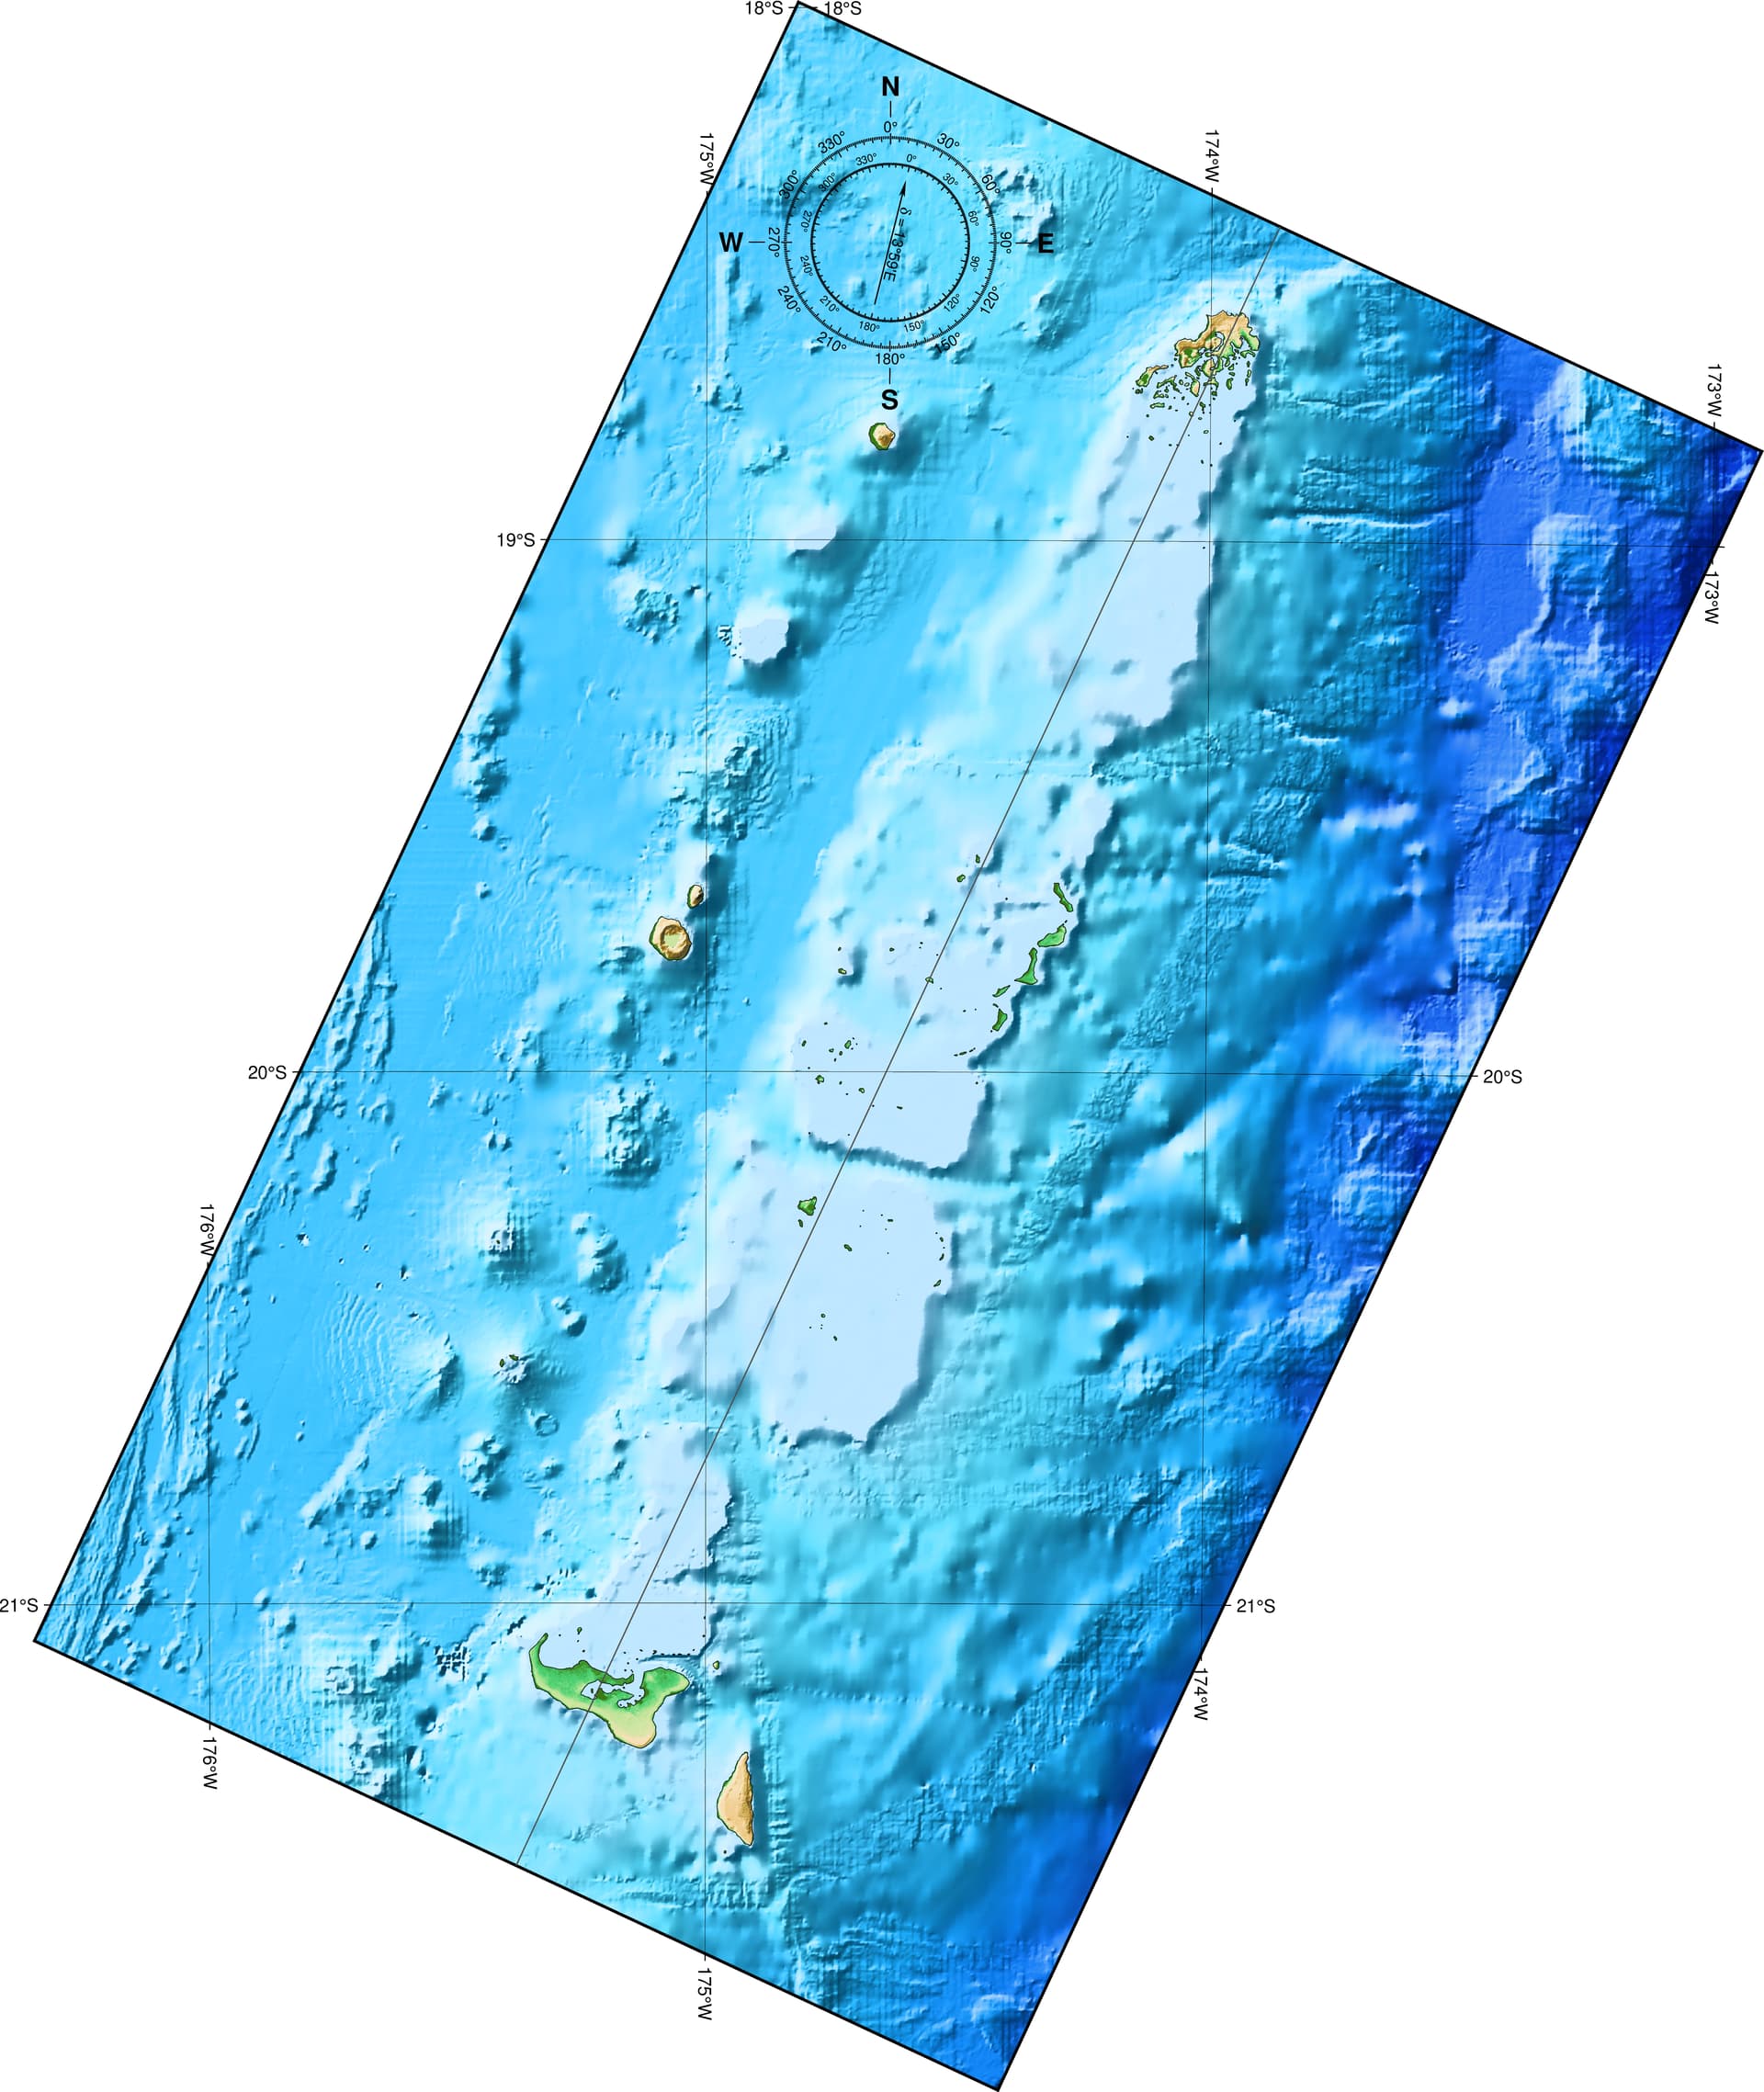
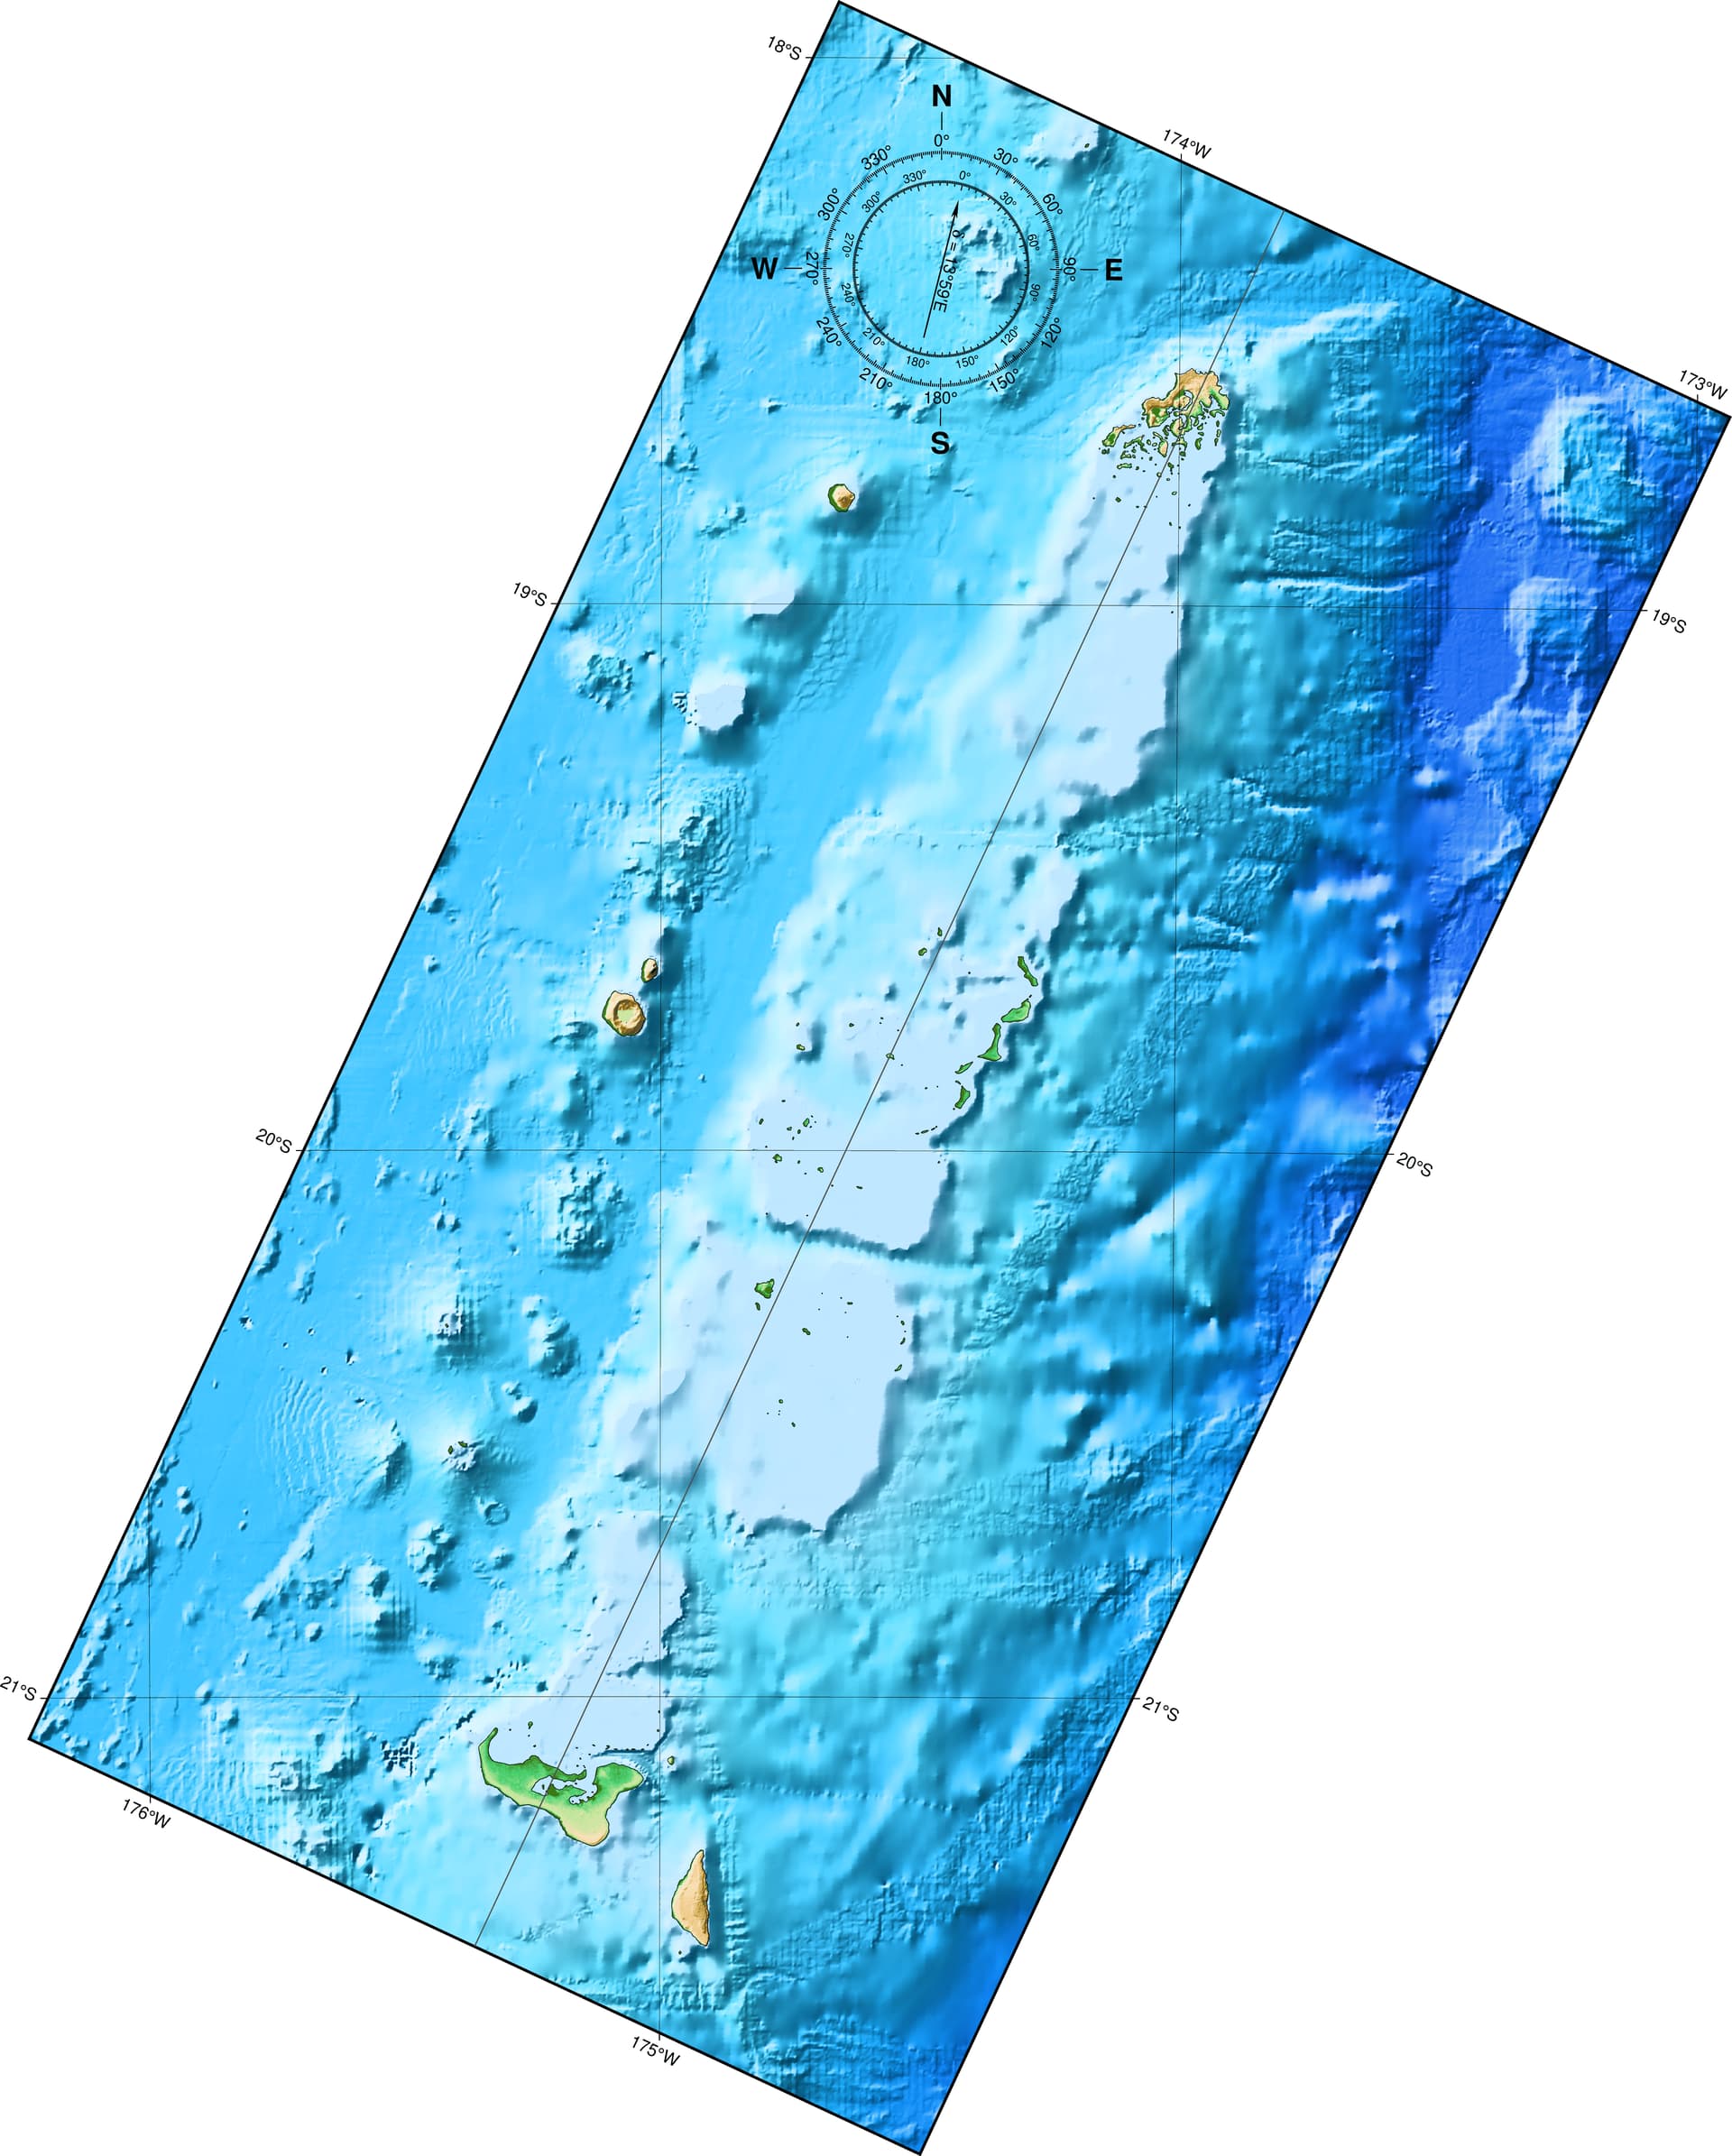
Edit - more experimenting.
I realised the azimuth I should have been using was 25 degrees, not 115 degrees. The units being specified in kilometres is handy. Here is about the best I can do:
#!/usr/bin/env bash
#
# Oblique Mercator projection for Tonga. Aim to minimise distortion for Tongatapu,
# Haʻapai and Vavaʻu island groups.
region=-177/-172/-23/-17
centre=175:12:2W/21:7:53S		# Royal palace, Nukuʻalofa.
azimuth=25

gmt begin tonga png
	gmt set PROJ_ELLIPSOID GRS-80
	gmt set PROJ_SCALE_FACTOR 1
	gmt set MAP_GRID_PEN faint,black
	gmt set MAP_ANNOT_OBLIQUE lon_horizontal,lat_horizontal,tick_extend
	if [[ ! -f tonga_dem.nc ]]
	then
		gmt grdlandmask -Df -I3s/3s -R${region} -Gmask.nc
		gmt grdmath -R${region} mask.nc @earth_relief_03s DUP 0 GT MUL DUP 1 IFELSE \
			@earth_relief_03s DUP 0 LT MUL DUP -1 IFELSE IFELSE = tonga_dem.nc
	fi
	gmt grdimage tonga_dem.nc -JOA${centre}/${azimuth}/25c+v -Cetopo1 \
		-R-350/40/-100/100+uk -I -p-${azimuth}
	gmt coast -Df -Wthinnest,black -BWSEN -Ba1g1+f \
		-TmjLT+d13.99+w6c+l -p
	gmt project -C${centre} -A${azimuth} -G1d -L-180/180 | gmt plot -Wthin,80 -p
gmt end

pngquant --ext .png --force tonga.png
open tonga.png
Ok. Where can I find which projections support ellipsoids?
Edit: I looked at the source code in gmt_proj.c It seems Oblique Mercator just uses the equations for Mercator, after appropriate rotations and shifts have been done. Mercator seems to be only coded up for the sphere. In contrast, Transverse Mercator has been coded up for the ellipsoid, at least for small regions.
I’m going to investigate the PROJ library functionality introduced in Version 6(?) to see if it can do what I want. This is an interesting learning experience!
The tricky thing with the Oblique Mercator projection is that the -R option behaves differently—it aligns with the rotated projection, which makes it hard to get a clean, vertical rectangle like you want. One practical workaround is to project all your data into Cartesian coordinates first (using tools like grdproject and project), rotate it manually (with something like grdrotate or even an affine transform), and then plot it using the standard -Jx projection. That way, you get full control over the layout, and you can still make sure North points up while filling in those white gaps.
Projecting to Cartesian coordinates is what I’m doing now. I’m using the proj functionality, but running into problems with grdproject - I’m starting to think there might be a bug in grdproject (but still, it’s more likely a user problem ).
This is the projection in proj syntax; I’ve added false eastings and northings of 1,000,000 m to make all the region of interest have positive coordinates:
I confess that I still didn’t get what you want to achieve (got it that is an oblique non horizontal or vertical).
Regarding the practicalities, I sugest that you use gdalwarp directly. I never remember the details, but have recalls that tell me that grdproject may fail when the PROJ projection cannot find an equivalent in the GMT syntax. mapproject does not have any restriction and works with all PROJ projections.
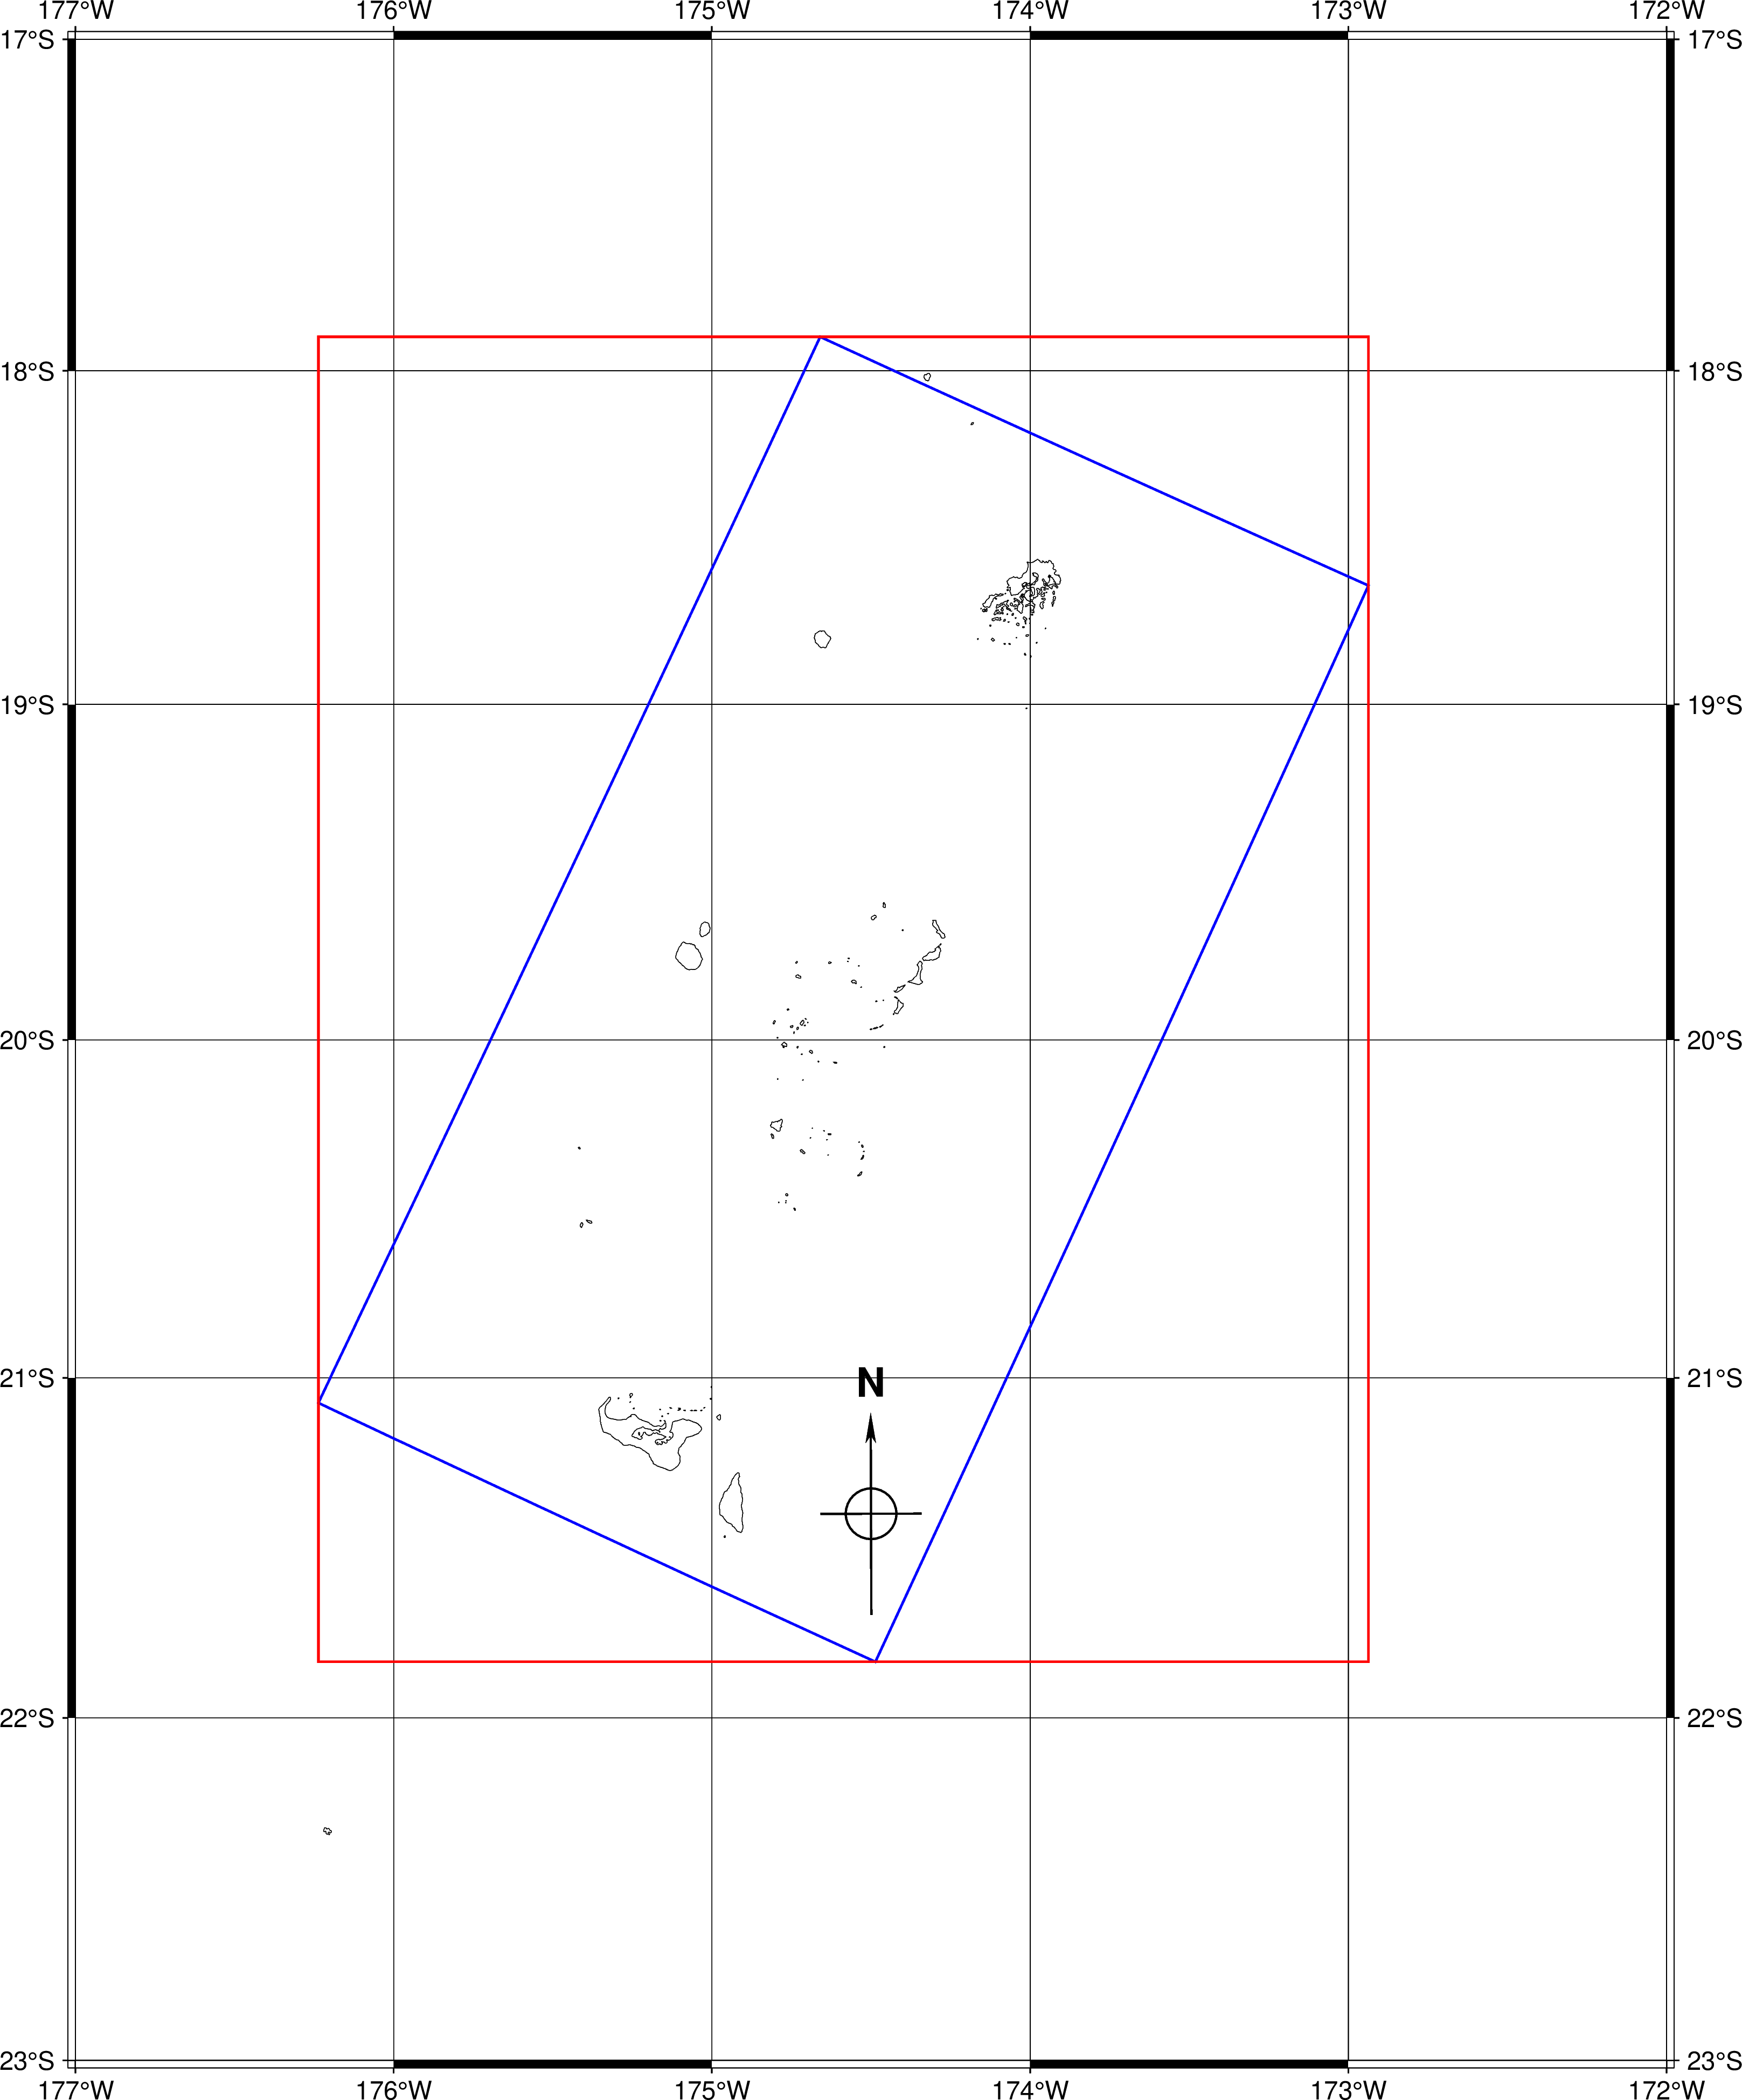
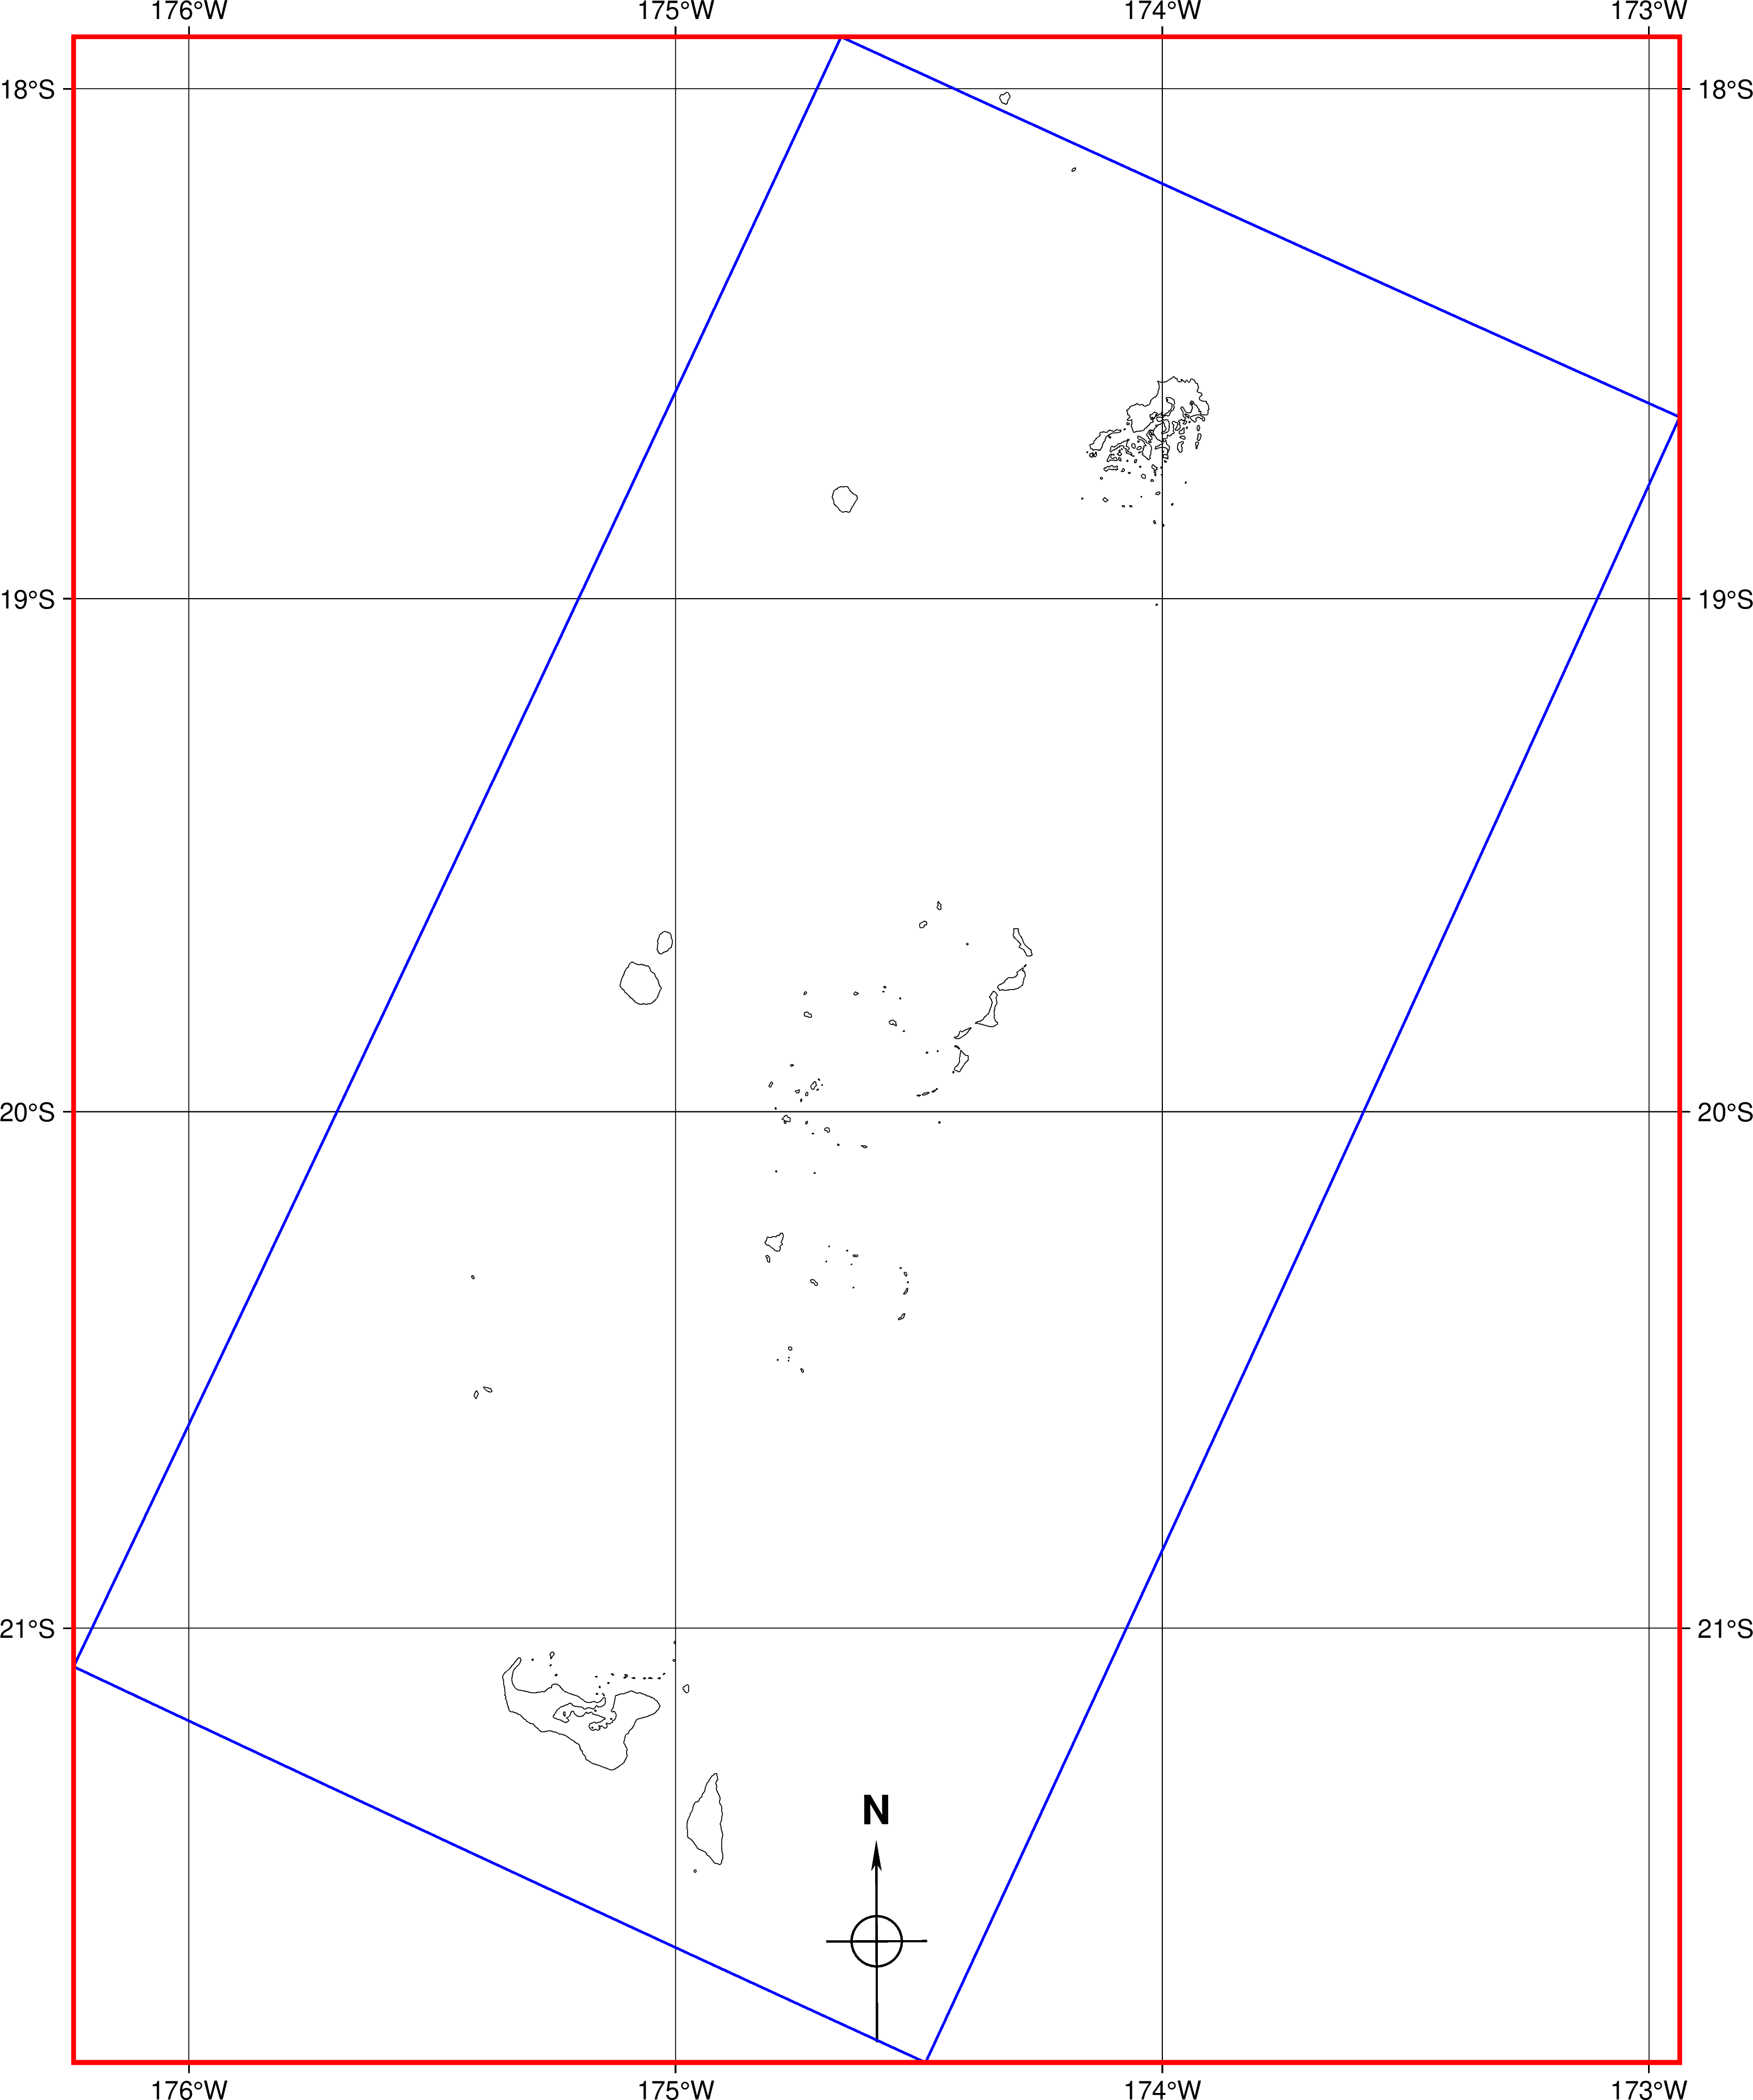
Below is my understanding of the quote above. First plot “tonga-M.png” is visualization of the polygons, blue is oblique polygon according to the -JOA${centre}/${azimuth}/25c+v definition, red polygon is WSEN boundary around the blue polygon. The second plot “tonga-M1.png” is a Mercator map plotted using the red WSEN as the plot boundary, plus the blue oblique polygon is plotted just for illustration.
#!/usr/bin/env bash
#
# Oblique Mercator projection for Tonga. Aim to minimise distortion for Tongatapu,
# Haʻapai and Vavaʻu island groups.
region=-177/-172/-23/-17
centre=175:12:2W/21:7:53S		# Royal palace, Nukuʻalofa.
azimuth=25

SIMPLE_ARROW=-TdjBC+l+o0/7c # simple arrow, bottom left
R=-R-177/-172/-23/-17
J=-JM25c

gmt begin tonga-M png
	gmt coast -Df -Wthinnest,black -BWSEN -Ba1g1+f $J $R $SIMPLE_ARROW

    gmt mapproject -JOA${centre}/${azimuth}/25c+v  -R-350/40/-100/100+uk -We+n2 |\
        gmt plot $J $R -W1p,blue

CMD="gmt mapproject -JOA${centre}/${azimuth}/25c+v  -R-350/40/-100/100+uk -Wr"
echo $CMD # debug output
CMD_OUTPUT=$($CMD)  # saving output
echo "WSEN is $CMD_OUTPUT" # debug output
# extracting $WSEN
W=$(echo "$CMD_OUTPUT" | awk '{print $1}')
E=$(echo "$CMD_OUTPUT" | awk '{print $2}')
S=$(echo "$CMD_OUTPUT" | awk '{print $3}')
N=$(echo "$CMD_OUTPUT" | awk '{print $4}')
# producing a red polygon out of WSEN above
cat << EOF > red.txt
$W $S
$W $N
$E $N
$E $S
$W $S
EOF
# plotting the red polygon
     gmt plot red.txt $J $R -W1p,red -A
gmt end

# mapproject ... -WR produces -RW/E/S/N string, same as the red polygon above
CMD="gmt mapproject -JOA${centre}/${azimuth}/25c+v  -R-350/40/-100/100+uk -WR"
echo $CMD # debug output
R=$($CMD)  # debug output
echo "WSEN is $CMD_OUTPUT" # debug output

SIMPLE_ARROW=-TdjBC+l # simple arrow, bottom center

gmt begin tonga-M1 png
# plot coastline with -R from mapproject ... -WR:
    gmt coast -Df -Wthinnest,black -BWSEN -Ba1g1+f $J $R $SIMPLE_ARROW --MAP_FRAME_TYPE=plain
# visualize blue oblique polygon
    gmt mapproject -JOA${centre}/${azimuth}/25c+v  -R-350/40/-100/100+uk -We+n2 |\
        gmt plot $J $R -W1p,blue
# visualize red straight polygon from above
    gmt plot red.txt $J $R -W2p,red -A -N
gmt end
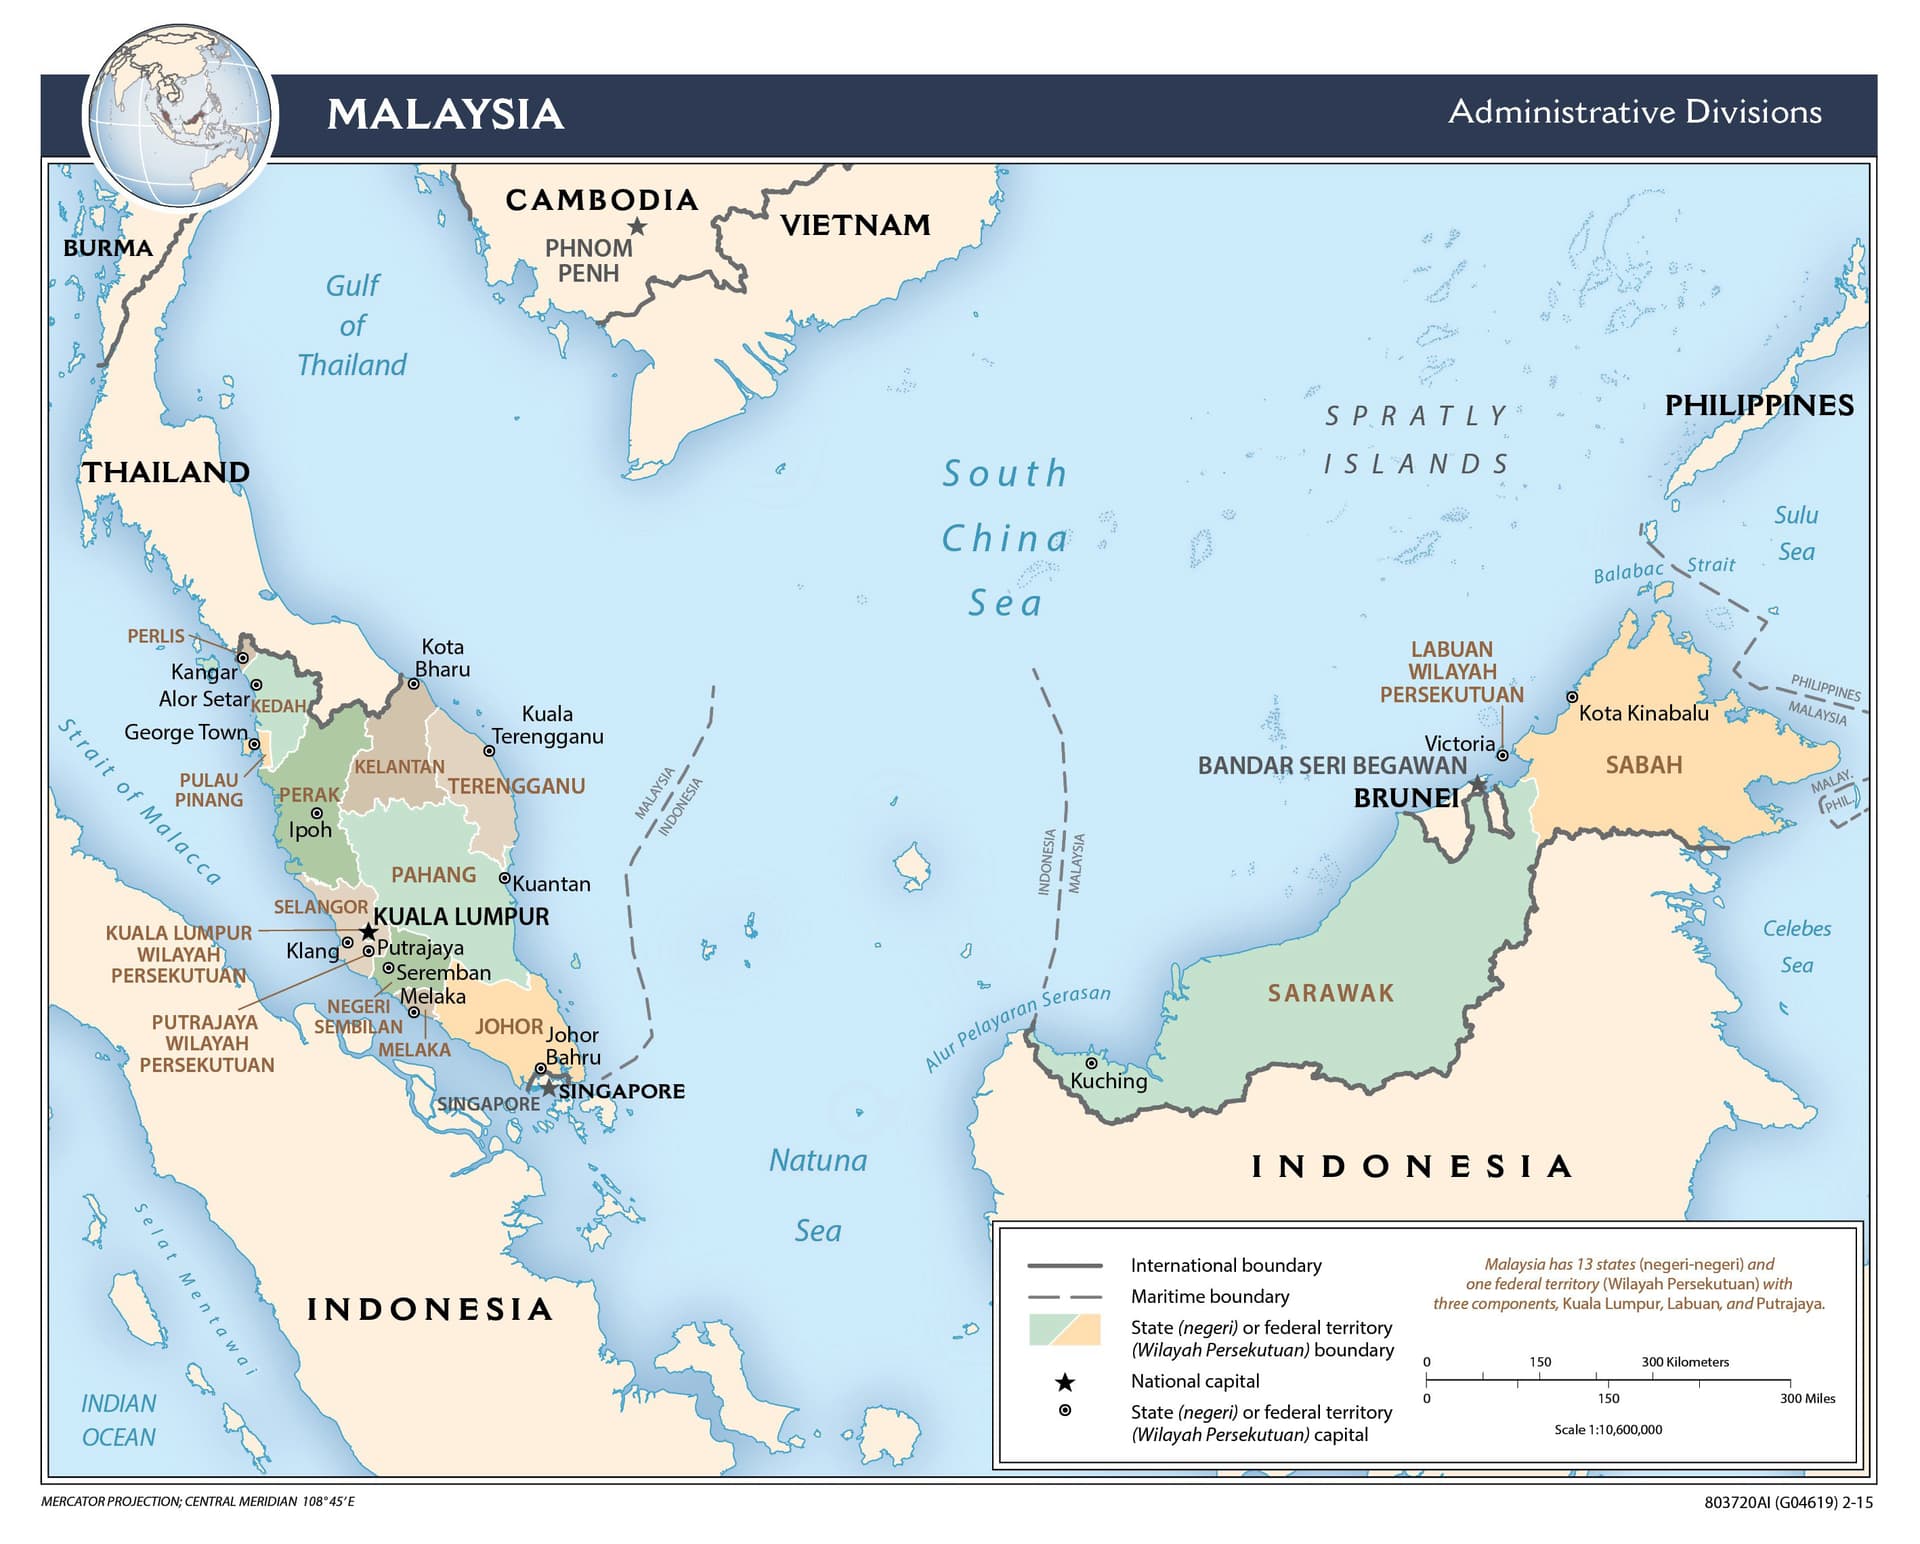
The Oblique Mercator is used by a few countries as their standard map projection. This presentation mentions Hungary, Switzerland, Malaysia and Madagascar. Alaska (or part of it) is also mentioned.
For places with a large north-south extent, Transverse Mercator is more commonly used. But for a narrow country which isn’t running directly north-south (or east-west, where Mercator would be good), the Oblique Mercator potentially introduces less distortion than the Transverse Mercator. In the map below, it’s immediately apparent why Oblique Mercator is suited to a places like Malaysia, parts of Indonesia and Thailand - they are narrow countries, but not aligned directly north-south (suited to Transverse Mercator) or east-west (suited to normal Mercator). In fact, when one thinks about it, Mercator and Transverse Mercator are just specific versions of the Oblique Mercator.
I started playing around with this just for fun. And I have to say I’ve learnt a lot about map projections, ellipsoids, geoids and so on in the last few days! The tips given here by various people , as well as extensive reading and web searching has been quite enjoyable. Thanks everyone!
As is common with many map projections, North-South doesn’t run vertically up the paper. The idea I had was by simply rotating the final map, North and South could be made to be vertical on the paper, and this would be more familiar to people who are used to the standard Mercator map in atlases, Google Maps etc. But a simple rotation (which is easy with -p) looks like the examples I showed - it reminds me of a box toppling over! I simply want to fill in the spaces around the edges so it doesn’t look like a toppling box.
In the process of this I saw the map projection code in GMT. I have to say the GMT code is reasonably easy to read. One day, when time permits, and when I have acquired enough familiarity, I’d like to contribute back to the code in some way. GMT has served me for more than three decades, and I hope it continues to be developed
For vector data - yes sure, cadaster data are all vectors (streets are lines, houses and all other areas are polygons, there are many point objects etc).
For raster data - I have very strong though poorly educated doubts.
I don’t really know what all those countries use the Oblique Mercator for, and for my task it doesn’t really matter. I just wanted an Oblique Mercator map on the ellipsoid because
I simply thought it was cool to try and find a map projection for a particular region which had minimal distortion. And in the process I learned a lot of new stuff.