Accuracy of GSHHG vs SRTMGL1

Dear GMT Gurus,

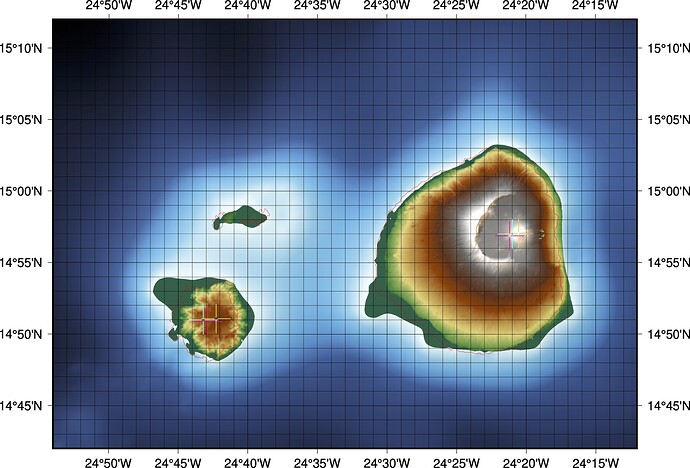
I’m currently experimenting with the new global relief datasets provided via the @-handle. While it is a very convenient service I was wondering where the discrepancies come from:

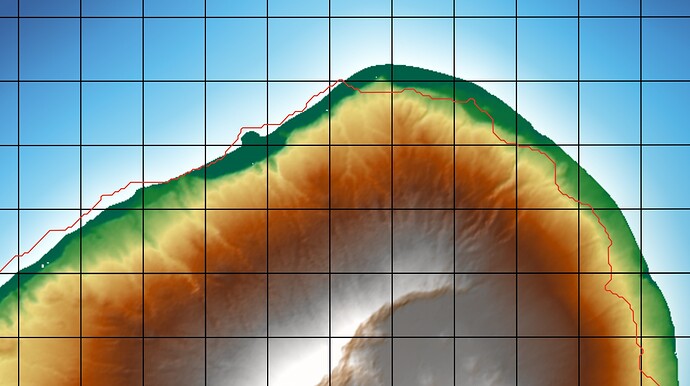
You are looking at the northern shore of the small Ilha de Fogo, Cape Verde in the Atlantic Ocean. The red line is the GSHHG data, the terrain is the SRTMGL1 data via @earth_relief_01s.

It seems as if the GSHHG outlines are shifted west by about 0.7’. Or maybe the SRTM data is shifted east? To verify I tried to plot the highest peak (Pico do Fogo) from three different datasources:

  1. Cabo Verde 2015 Statistical Yearbook (page 25) – Instituto Nacional de Estatística Cabo Verde (INE)
    N14°56’52", W024°21’11" is given as location and the Statistical Yearbook of Cabo Verde, 1946 is cited as source. No information is given about the datum or if the location was converted to WGS84.
    Pink in plots.

  2. Global Volcanism Program – Smithonian Institution (SI)
    14.94°N, 24.35°W is provided as location, no source cited.
    Cyan in plots.

  3. German Wikipedia Entry (WP)
    14° 57′ 2″ N, 24° 20′ 32″ W is provided as location, no source cited.
    Yellow in plots.

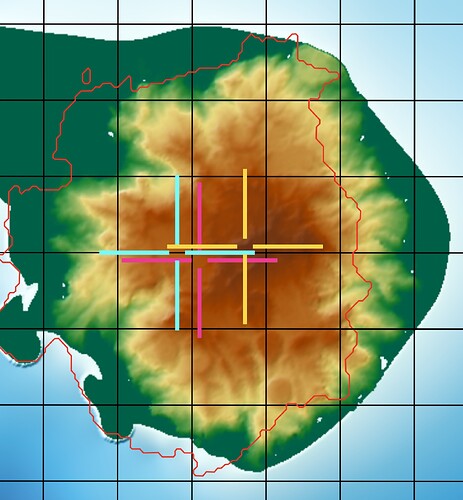
Same was done for the highest peak (Fontainhas) on the Ilha Brava just west of Fogo. The same sources were used.

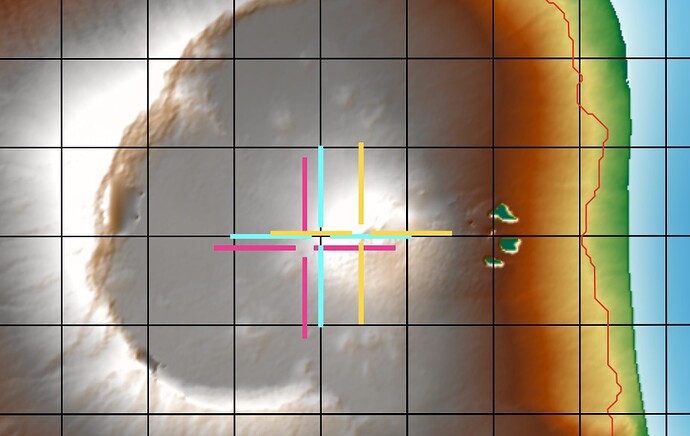
The coordinates provided by Wikipedia (yellow) are spot on the SRTM data:

It is pretty clear, that the Global Volcanism Program data (cyan) is just too crude to be useful. Interestingly the shift in the INE data (pink) corresponds surprisingly well with the shift in the GSHHG data:

Just compare the differences on the southern most tip of the island and the coastline features in the north-western part.

Pico de Fogo:
N 14° 57' 02", W 024° 20' 32" (Wikipedia)
N 14° 56' 52", W 024° 21' 11" (INE)
10" difference in latitude
39" difference in longitude

Fontainhas:
N 14° 51' 05", W 024° 42' 17" (Wikipedia)
N 14° 50' 54", W 024° 42' 54" (INE)
11" difference in latitude
37" difference in longitude

I lean towards INE using a geodetic reference other than WGS84 and GSHHG is just assuming that they are WGS84.

Now my question: How do I get them to match?

Script to play with:

#!/bin/bash

cat > coord0.def << END
-0.5   0    M
-0.05  0    D
 0.05  0    M
 0.5   0    D
 0    -0.5  M
 0    -0.05 D
 0     0.05 M
 0     0.5  D
END

cat > peaks_WP.txt << END
-24.342222 14.950556 1 # Pico do Fogo
-24.704722 14.851389 1 # Fontainhas
END

cat > peaks_INE_CV.txt << END
-24.353056 14.947778 1 # Pico do Fogo
-24.715000 14.848333 1 # Fontainhas
END

cat > peaks_GVP_SI.txt << END
-24.35 14.95 1 # Pico do Fogo
-24.72 14.85 1 # Fontainhas
END

gmt begin cape_verde
    gmt grd2cpt -Cetopo1 @earth_relief_01s
    grdimage @earth_relief_01s -R-24.9/14.7/-24.2/15.2r -JA-24.55/14.95/20c -I+d -Bg
    gmt coast -Df -Wthinnest,red -Bag
    gmt plot peaks_INE_CV.txt -Skcoord0 -Wthin,deeppink
    gmt plot peaks_GVP_SI.txt -Skcoord0 -Wthin,cyan
    gmt plot peaks_WP.txt -Skcoord0 -Wthin,gold
gmt end show

Thank you for your advice & all the best,

Kristof
Kristof, you are seeing mostly a difference in datum. GSHHG is old, from an epoch before the WGS72, so when plotted on top of WGS84 data that difference in datum shows clearly. Now what datum was used to plot the data that CIA digitized from maps around the world, is a non unique answer. For the Cabo Verde case, it was Portuguese cartography and very likely they used the 1924 International ellipsoid. See mapproject -T & -Q options on how you can try to do datum shifts.

On the long run, the answer is to have a new GSHHG database that is based on WGS84. There are plans for that, but that’s a significant amount of work.

1 Like

It is more than a datum problem. it is just inaccurate data. In the past we have shifted a few islands like this to better fit - e.g., Society Islands come to mind. It is a lot of hassle and endless. For the short term you will need to seek better data yourself. Slightly longer term: we think we will be funded by NSF to among other things build GSHHS 3 from OpenStreetMap data.

I compared the GSHHG data to the coastlines of OpenStreetMap for an area in Puerto Rico, and I found a shift of about 400 meters. As @pwessel and @Joaquim mention, the GSHHG is inaccurate. OpenStreetMap is available from https://www.openstreetmap.org/ and seems to match the SRTM datasets (topography and water mask) very well. You can use GDAL to convert shapefiles to GMT vectors, but maybe GMT 6 now reads shapefiles?

Hi @EJFielding,

would you mind elaborating a bit on how to extract shape files from OSM? I only find the database export ending in .osm which I can only open in QGIS/similar with an importer module.

I guess there is an easier way? I’m not a seasoned OSM user.

Thank you,
Kristof

Do you have a rough estimate for a time frame? Are we talking months? Or years? Decades?

We can rule out (a few) months and decades. If funded then we hire a postdoc who will take some time to come onboard and then will have many tasks, including that one, so realistically a few years.

Thank you @pwessel for your estimate. As you said, I’ll better look for own data in the meantime.

Joaquim, your input with the 1924 International ellipsoid is a great idea given the history of Cape Verde pre 1975. I tried to navigate the Portuguese Sistema Nacional de Informação Geográfica (SNIG) web presence but was unable to find anything about the Cape Verde Islands. Most probably due to my lack of Portuguese.

However I found the document Spatial Data Infrastructures in Portugal: State of play Spring 2004 (pdf) on the page and it supports your claim of the general usage of the 1924 International ellipsoid in this timeframe. I will give mapproject -T & -Q a try. Thank you!

How to use OSM coastlines in GMT

As @pwessel and @Joaquim said, the GSHHG data is somewhat inaccurate on small scales. Too inaccurate for my use case. For the benefit of other users running into the same problem here is my take on using OpenStreetMap (OSM) data for coastlines while we wait for GSHHG 3. I hope it is helpful to someone.

Data Source:

The OSM Wiki has some sources for shape file downloads. I found https://osmdata.openstreetmap.de/data/land-polygons.html very useful. Make sure to get the Land Polygon in the Large polygons not split version with WGS84 datum. It’s a ~630 MB download.

Usage:

You need GDAL installed! The data comes as ESRI shape file which is not very helpful for the use in GMT. While GMT does convert it under the hood into a usable format this is rather CPU-heavy. As I intend to use the data for several projects, I converted it into something useful. This is where you need GDAL on your system:

ogr2ogr -F GMT landpoly_osm.gmt land_polygons.shp

The resulting land poly_osm.gmt is a whopping ~1,24 GB large. Now just use it with gmt plot as you would with any other polygon file.

Lets have a look at it how the OSM data compares to GSHHG and SRTMGL1 around the Cape Verde Islands:

gmt begin caboverde
  gmt set PS_LINE_CAP round
  gmt set PS_LINE_JOIN round
  gmt set MAP_GRID_PEN_PRIMARY 1p,black
  gmt grdimage @earth_relief_01s -JL-24/16/15/17/40c  -R-25.5/14.5/-22.5/17.5r -I+d
  gmt coast -Wthinnest,red
  gmt plot landpoly_osm.gmt -Wthinnest,green -Ba1dg1df10m
gmt end show

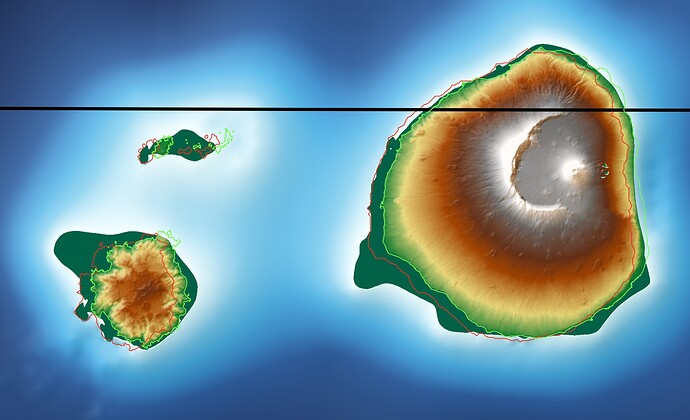
Cropped from above output – GSHHG in red, OSM in green:

I find the green OSM outlines matching the SRTM data quite accurately. Precise enough for my use case at least. There is room for improvement (why use a 1,24 GB file when you only want a small subpart of it) but as a proof of concept it works nicely.

If you improve this workflow please share it here for others to benefit from it as well. Thank you.

1 Like

It will shrink the file and speed up execution if you convert the bloated ASCII .gmt file to binary, probably something like

gmt convert landpoly_osm.gmt -bo2d > landpoly_osm.bin

and then use the bin file and the -bi2d option.

1 Like

I assume your .gmt file has two columns (lon,lat). If it has a 3rd for whatever reason then you may need -i0:1 in the gmtconvert example.

Thank you, @pwessel, that’s pretty impressive – it basically halves the execution time of gmt plot when using the binary file!

For those following along as I can’t edit my original post:

ogr2ogr -F GMT landpoly_osm.gmt land_polygons.shp

gmt convert landpoly_osm.gmt -bo2d > landpoly_osm.bin

gmt begin caboverde
  gmt set PS_LINE_CAP round
  gmt set PS_LINE_JOIN round
  gmt set MAP_GRID_PEN_PRIMARY 1p,black
  gmt grdimage @earth_relief_01s -JL-24/16/15/17/40c  -R-25.5/14.5/-22.5/17.5r -I+d
  gmt coast -Wthinnest,red
  gmt plot landpoly_osm.bin -bi2d -Wthinnest,green -Ba1dg1df10m
gmt end show

And if you are wondering how to measure script execution time: just use time when you call your script:

time ./your_script.sh

And after some coffee I realized that double precision is overkill. Using single precision, with floating point precision of 1.19e-07, translates into a precision in lon/lat coordinates of ~1 cm. Good enough for government work. So I would recommend

gmt convert landpoly_osm.gmt -bo2f > landpoly_osm.bf2

and then use -bi2f in your plot call. Halves the size of the binary file and possibly speeds up your script a tiny bit.

@KristofKoch variants of this question do come up quite often which to me indicates that there should be a page in the GMT Cookbook or Gallery explaining who to use OSM data with GMT and why you might want to do that. Your example s(and lovely detailed replies) would make a great addition. Would you mind contributing that to the docs in the GMT repo? I’d be more than happy to provide any guidance and help you get started.

Paul, thank you for your recommendations. I did as you said and it shaved another 5 seconds from the gmt plot call:

  • 62s – ASCII (~1240 MB)
  • 31s – double-precision (~893 MB)
  • 26s – single-precision (~447 MB)

Current state of the workflow:

ogr2ogr -F GMT landpoly_osm.gmt land_polygons.shp

gmt convert landpoly_osm.gmt -bo2f > landpoly_osm.bf2

gmt begin caboverde
  gmt set PS_LINE_CAP round
  gmt set PS_LINE_JOIN round
  gmt set MAP_GRID_PEN_PRIMARY 1p,black
  gmt grdimage @earth_relief_01s -JL-24/16/15/17/40c  -R-25.5/14.5/-22.5/17.5r -I+d
  gmt coast -Wthinnest,red
  gmt plot landpoly_osm.bf2 -bi2f -Wthinnest,green -Ba1dg1df10m
gmt end show

All the best,
Kristof

Leo, I wouldn’t mind contributing. Maybe let’s move this conversation to private channels.

Sorry if I’m not satisfied, 26 s is certainly better than 62 but it’s still awfully slow.
We need a indexed accelerated solution.

Well, you are right @Joaquim. When I compare

 gmt plot -JL-24/16/15/17/40c -R-25.5/14.5/-22.5/17.5r landpoly_osm.bf2 -bi2f -Wthinnest,green

running 26 seconds against GSHHG with

gmt coast -JL-24/16/15/17/40c -R-25.5/14.5/-22.5/17.5r -Wthinnest,red

taking only 2 seconds to complete it is pretty obvious. coast using GSHHG is just 13 times faster …

But I must admit I have no idea on how to make an “indexed accelerated solution”. Maybe you can elaborate a bit on it?

He means inserting the OSM data into GSHHG which bilds polygons on the fly as needed. This is the long-term solution we discussed earlier.