Dear All,
I am trying to insert axis values inside the inset plot but could not find a way to do so. Here is my script. If i append +r then inset plot size also expanded.
x=-Bxa5f1
y=-Bya0.5f0.2
range=-R130/170/0/1
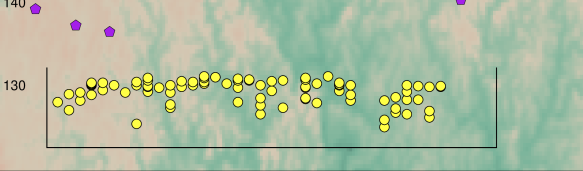
gmt inset begin -D130/170/0/1 -Dx0.1/0.5+w14.c/2.5c+o2.4c/0.2c -V
gmt basemap $range -JX? $x $y -BWSne
awk '{print $3,$4}' ev_jday.dat |gmt plot -Sc0.3c -Gyellow -W0.5,black
gmt inset end