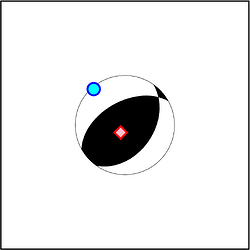
How can I add the P-, and T-axis to the focal mechanism using “meca”? Thanks
Here is the data: “result.dat”
Longitude Latitude Depth_(km) mrr mtt mff mrt mrf mtf Exponent_(dyn-cm) Seismic_moment_Mo Magnitude_Mw Strike_A Dip_A Rake_A Strike_B Dip_B Rake_B Slip_trend_A Slip_plunge_A Slip_trend_B Slip_plunge_B Trend_P Plunge_P Trend_B Plunge_B Trend_T Plunge_T fclvd Isotropic X_Kaverina Y_Kaverina ID Rupture_type
120.7 22.97 23.8 2.81256 0.852232 -3.66479 -1.55627 -2.87962 1.83599 25.0 5.01187e+25 6.4 191.0 69.0 123.0 309.892 38.467 35.1764 39.8916 51.533 281.0 21.0 257.188 17.4718 357.899 30.5616 141.708 53.8082 4.10626e-17 2863310000.0 0.36454 -0.0375217 20100304001852 R-SS
120.62 22.98 18.9 0.569991 -0.349444 -0.220547 0.222951 -1.15389 0.605204 23.0 1.41254e+23 4.7 163.0 77.0 113.0 280.921 26.2449 30.5772 10.9214 63.7551 253.0 13.0 234.7 28.369 337.546 22.3781 99.9865 52.4928 1.37332e-16 0.0 0.227692 -0.209501 20100304002447 R
120.63 22.95 17.6 3.99201 -2.2319 -1.76011 -0.0741868 -1.57585 2.33581 21.0 4.46684e+21 3.7 148.0 54.0 110.0 296.233 40.5158 64.7913 26.2332 49.4842 238.0 36.0 223.897 7.00379 315.924 16.0634 111.112 72.3996 4.00415e-17 174763.0 0.622968 -0.225742 20100304004326 R
my code:
import pygmt
minlat, maxlat, minlon, maxlon = 22.75, 23.25, 120.35, 120.95
focal = pd.read_csv("result.dat",delim_whitespace=True)
mindep, maxdep = 0, 30

fig = pygmt.Figure()
topo_data = '@earth_relief_03s' #30 arc second global relief (SRTM15+V2.1 @ 1.0 km)
pygmt.makecpt(
    cmap='grayC',
    series='0/5000/200',
    continuous=True
)
fig.grdimage(
    grid=topo_data,
    region=[minlon, maxlon, minlat, maxlat],
    projection='M20c',
    shading=True,
    frame="a",
    transparency = 0
    )
# ['SS', 'SS-R', 'SS-N', 'N-SS', 'R-SS', 'N', 'R']
rupc = {'SS':'green', 'SS-R':'green', 'SS-N':'green', 'N-SS':'blue', 'R-SS':'red', 'N':'blue', 'R':'red'}

for i in range(0,len(focal)):
    fc = rupc[focal['Rupture_type'].values[i]]
    fig.meca(
    dict(
        strike = focal['Strike_A'].values[i],
        dip = focal['Dip_A'].values[i],
        rake = focal['Rake_A'].values[i],
        magnitude=focal['Magnitude_Mw'].values[i]+0.2
    )
        , scale="1.5c"
        , compressionfill=fc
        , extensionfill="white"
        , longitude=focal.Longitude.values[i]
        , latitude=focal.Latitude.values[i]
        , depth=focal['Depth_(km)'].values[i]
        , outline = True
        , pen="0.5p,gray30,solid"
            )
fig.coast(shorelines=True)
fig.show()
