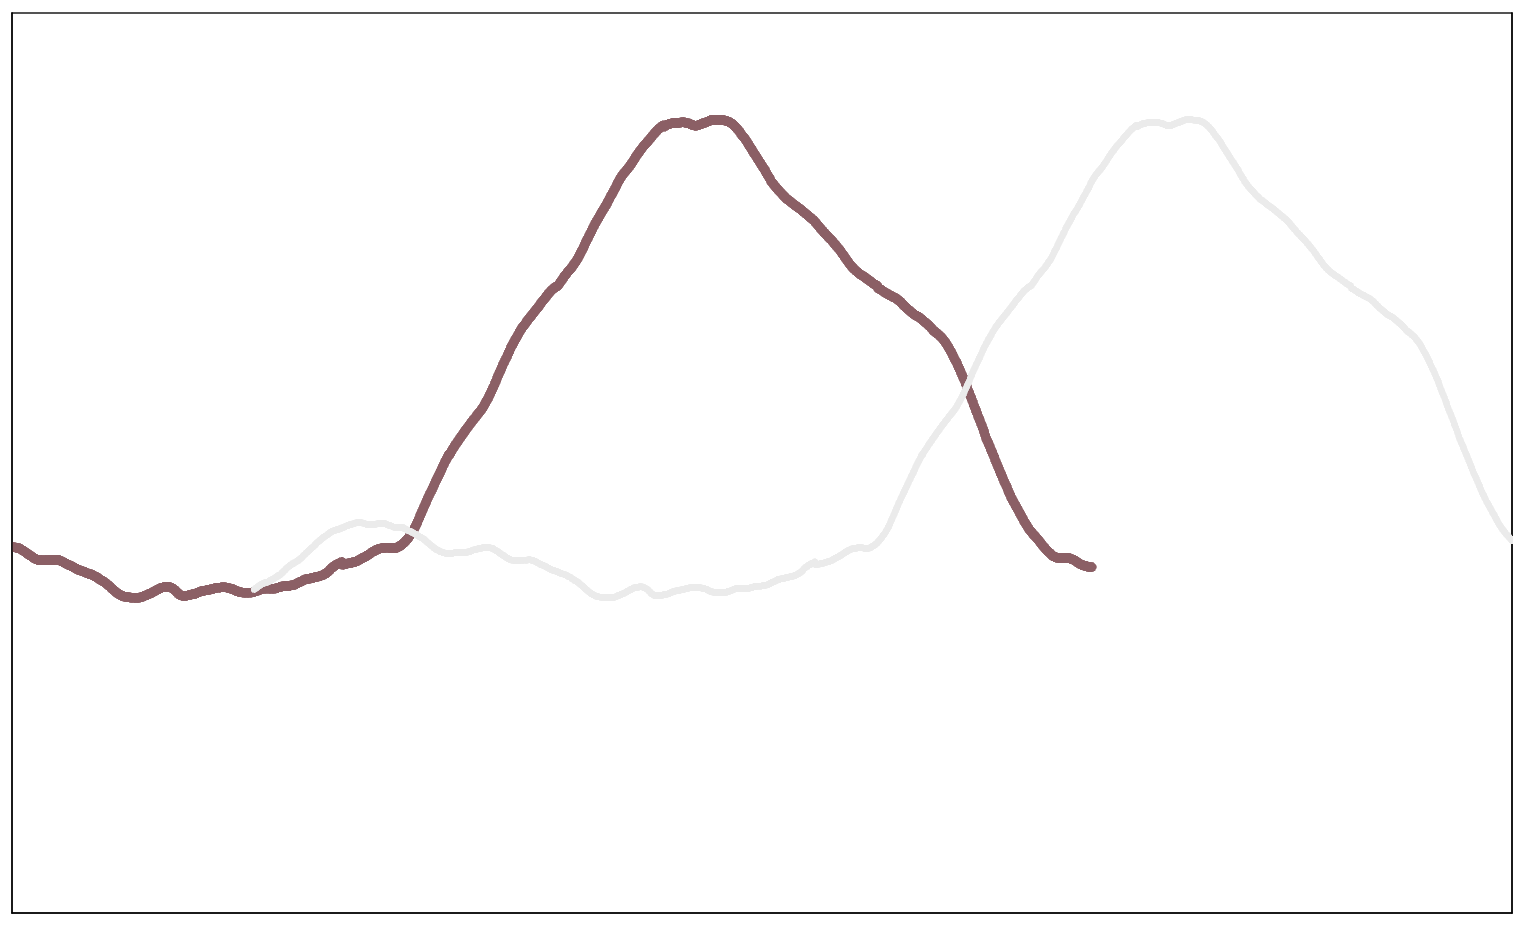
I want to do an animation of the two-time series. I have two time series with some distance (time) apart as shown in the figure below. What I want to show is to slide the time series on the right (light grey) and move it until it overlaps with the brown time series. Any hint?
For the details, you can look at “animations” in the doc. There are some relevant examples.
I’d plot the brown one in “preflight” and the gray one in “main” subtracting an incremented dt at every step.
To do so, I would probably try something like :
- Create a simple list for the movie command
gmt math -T0/100/1 = list.txt
- Create the shift pattern
(syntax is most likely improper, of course the goal is to apply the operation only on the time column but output everything… you can test that on its own beforehand)
gmt math -C0 file.txt $MOVIE_COL0 dt MUL SUB = new.txt
gmt plot new.txt
- Feed the
moviecommand.
Have fun 
As a more concrete base :
#!/bin/bash


cat << 'EOF' > include.sh
projection="-JX10cT/5c"					 # figure size
region="-R2017-07-27T/2017-07-28T/20/50" # can be defined automatically
dt=60                                                              # in seconds (else change --TIME_UNIT)
EOF


cat << 'EOF' > pre.sh
gmt begin
	gmt math -o0 -T0/300/1 T = list.txt
	gmt basemap $projection $region -Baf -BWS+t"2017-07-27" --MAP_FRAME_TYPE=graph
	gmt plot brown.txt -Wdefault,brown -l"Brown"+jBR
gmt end
EOF


cat << 'EOF' > main.sh
gmt begin
	gmt math -fT grey.txt -C0 $MOVIE_COL0 $dt MUL SUB = new_grey.txt
	gmt plot $projection $region new_grey.txt -Wdefault,grey
gmt end
EOF

gmt movie main.sh -Sbpre.sh -Iinclude.sh -Ntest -C720p -Tlist.txt -D32 -Fgif
There might be more sophisticated or elegant way to do it … but this is straightforward