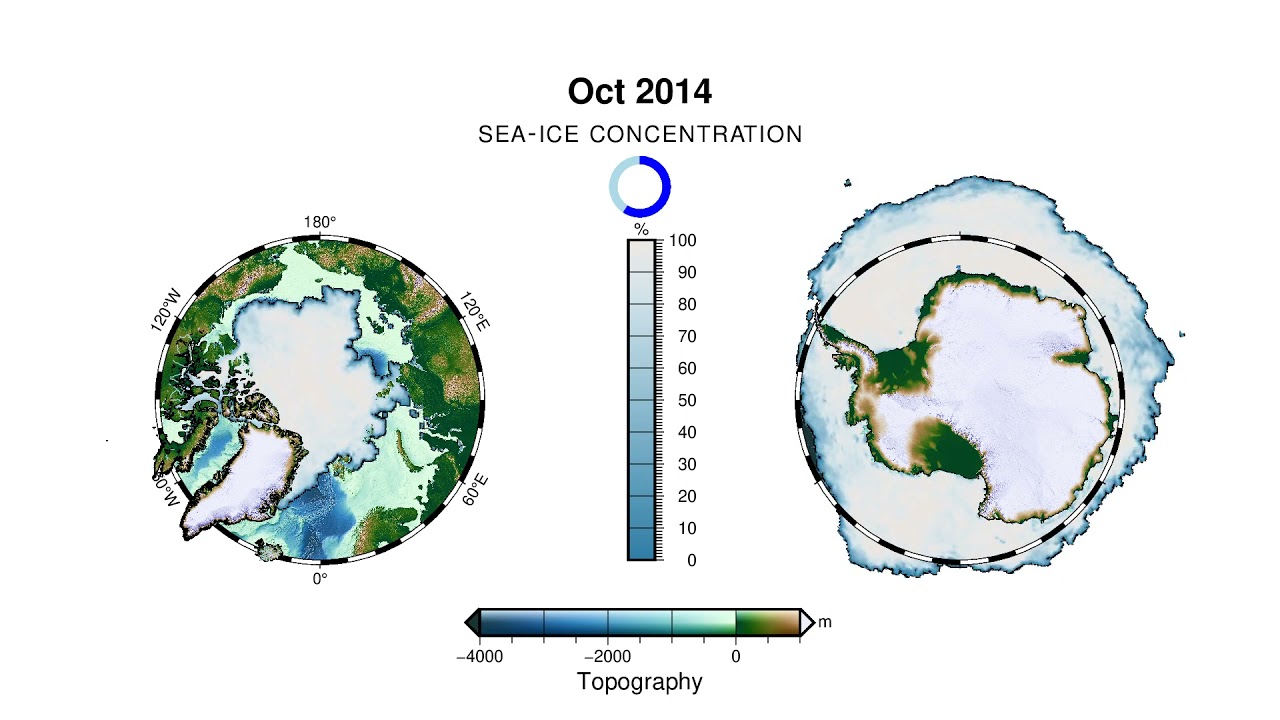
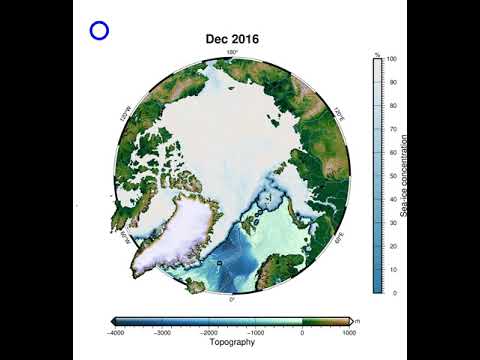
Animation : sea-ice concentration in the Arctic Ocean

Hi there !

Module used :

  • mapproject , grdproject , math , grdsample
  • makecpt , colorbar
  • grdimage , coast (including clipping) , basemap
  • clip
  • movie

Full script :

Animation : sea-ice cover in Arctic sea (2016).
Stereographic projection (-Js) with some regions leaking out of the frame
(based on IBCAO map)
DATASET :
topography and bathymetry
sea-ice

Include.sh

lon_ref=0           # map centered on Greenwich meridian
lat_ref=90          # map centered on North pole

lat_min=65          # map extend to 65th parallele
lat_out=55          # (extra) map extend to cover Greenland
lat_scl=77          # true scale at this parallele
scale=1:40000000    # map size (here ~ 14cm)

# Calculation used to properly place the plotted regions falling out of the frame
W1=$(gmt mapproject -R0/360/${lat_min}/90 -Js${lon_ref}/${lat_ref}/${lat_scl}/${scale} -Ww)
H1=$(gmt mapproject -R0/360/${lat_min}/90 -Js${lon_ref}/${lat_ref}/${lat_scl}/${scale} -Wh)
W2=$(gmt mapproject -R0/360/${lat_out}/90 -Js${lon_ref}/${lat_ref}/${lat_scl}/${scale} -Ww)
H2=$(gmt mapproject -R0/360/${lat_out}/90 -Js${lon_ref}/${lat_ref}/${lat_scl}/${scale} -Wh)
	
dx=$(gmt math -Q $W1 $W2 SUB 2 DIV =)
dy=$(gmt math -Q $H1 $H2 SUB 2 DIV =)

Pre.sh


gmt begin
    gmt makecpt -Cbukavu -T-4500/1500 -H > relief.cpt                                                   # Colormap for topography
    gmt makecpt -Cvik -G-0.5/0 -T0/101/1 -H -N > ice.cpt                                                # Colormap for sea-ice

    gmt math -o0 -fT -T2016-01-01/2016-12-31/1 T --TIME_UNIT=d --FORMAT_DATE_OUT=yyyymmdd = list.txt    # List of file's extension used as movie-frame (yyyymmddTHH:MM:SS)
    awk -F[T] '{print $1}' list.txt > list2.txt                                                         # Trim to yyymmdd

    gmt grdimage -R0/360/${lat_min}/90 -Js${lon_ref}/${lat_ref}/${lat_scl}/${scale} @earth_relief_01m -Crelief.cpt -I+d -Y4c    # DEM inner region with illumination, shifted up for colorbar
    gmt coast -Dh -Wthinnest,black -Ir/faint,lightblue  -Baf                                                                    # corresponding coast lines (+rivers) with framebox

    gmt coast -ECA.NU,GL,IS+c -R0/360/${lat_out}/90 -X${dx} -Y${dy}                                                             # Prepare outter region for clipping (shifted to match first layers)
    gmt clip -N << END                                                                                                          # ... but exclude this box
-80.75 ${lat_min} 
-120 ${lat_min} 
-120 ${lat_out}
-80.75 ${lat_out}
END
    gmt grdimage @earth_relief_01m -Crelief.cpt -I+d                                                                            # DEM outter region with illumination
    gmt coast -Dh -Wthinnest,black -Ir/faint,lightblue                                                                          # corresponding coast lines (+rivers)
    gmt clip -C                                                                                                                 # close excluded box clipping
    gmt coast -Q                                                                                                                # close outter region clipping

    gmt colorbar -Cice.cpt -DJMR+w${H1}c/0.5c+o-1.5c/0c -G0/100 -Np -Bxa10f1g10+l"Sea-ice concentration" -By+l"%"               # Colorbar (right) for sea-ice
    gmt colorbar -Crelief.cpt -DJBC+w${W1}c/0.5c+o0c/-1.5c+h+e -G-4000/1000 -Bafg+l"Topography" -By+l"m" -I                     # Colorbar (bottom) for relief
gmt end

Main.sh

gmt begin

    # # # # # # # # # # # # # # # # # # # # # # # # # # # # # # # # # # # # # # # # #
    # Operation on SEA-ICE coverage data :                                          #
    #   1. Reproject from (x,y) [km relative to the pole] to (lon,lat) [degree]     #
    #   2. Upsample using bilinear interpolation AND remove zeros (=NaNs)           #
    # # # # # # # # # # # # # # # # # # # # # # # # # # # # # # # # # # # # # # # # #

    gmt grdproject -R0/360/${lat_min}/90 -Js${lon_ref}/${lat_ref}/${lat_scl}/${scale} data/data_${MOVIE_COL0}.nc?"ice_conc" -Gdata_bis.nc -C -I -Fk
    gmt grdsample data_bis.nc+n0 -nl -I1m -Gdata_ter.nc

    gmt grdimage -R0/360/${lat_min}/90 -Js${lon_ref}/${lat_ref}/${lat_scl}/${scale} data_ter.nc -Cice.cpt -Q  -Y4c                              # plot sea-ice (ignore NaN's), aligned with main frame
    gmt basemap -B+t"$(gmt math -Q -o0 -fT ${MOVIE_COL0}T --FORMAT_DATE_IN=yyyymmdd --FORMAT_DATE_OUT=yyyy-o-dd = | awk -F[-] '{print $2,$1}')" # title ([abbr. month]<space>[year])

gmt end

# Movie command (with progress circle)
gmt movie main.sh -Iinclude.sh -Sbpre.sh -Narctic_mov -C20cx21.5cx120 -Tlist2.txt -D18 -Fmp4 -Pb+jTL+o1c/1.25c

(the glitch in March is due to a missing file. I should have check more carefully)
3 Likes

Impressive!! Very nice!!

1 Like

Thanks :slight_smile:
(But so far nothing can compete with your Messi animation)

1 Like

Really slick. Would you be interested in making an animation for inclusion to the animation gallery? I.e., make it HD and ideally pull the sea-icea data from a data place (we would like not having to store the data grids)?

It is HD no ?
But sure, I can make that… Though, the data can be heavy and/or long to download. What do you suggest ?

edit : FYI, 1 year of this dataset (daily, gridded) is ~3.6GB

By “HD” I mean 1980x1280 in 16:9 format. I think it is important that all our animations are reproducible, even if they take a long time to run or download. For instance, some of the animations takes a few hours to render, so I would not worry about a big download for those who wish to try and modify. I am just hoping there are not too many custom processing steps you did. Ideally, it is just a data download as part of pre.sh and then off to build the movie.

So you may need to make a few adjustments to fit the 24 x 13.5 cm HD “papersize”

Maybe two of these side by side, or Arctic vs Antarctic?

My nemesis ! The -C option of movie xD

The only thing I did to the dataset was to rename it to a shorter format (data_20160101.nc instead of ESACCI-SEAICE-L4-SICONC-AMSR_25.0kmEASE2-SH-20160101-fv2.1.nc)

Everything else is “as is” in the first post.

For the download from ECMWF, an account is required (a token is given for the API, then you can use a python script to download everything)

The subplot module doesn’t like -X, -Y shift … so it’s going to be just one big figure with a big shift between the two plots (-X15c or something)

Yes, may need to be a single figure with one part shifted by -X.

[updated video next post]

There was a lot of errors along the process. GMT is not yet very stable when the load is distributed on many cpus (24 here).

Here are some examples of the output I had (corresponding to the video uploaded)

bash poles_movie.sh 

movie_init.sh: line 29: ./gmt_project.sh: Text file busy
grdproject [ERROR]: Cannot find file 3
grdsample [ERROR]: Cannot find file data_bis.nc
gmtmath [ERROR]: Operation "ADD" requires 2 operands
grdproject [WARNING]: For a UTM or TM projection, your region -1.000000000000/1.000000000000/89.000000000000/91.000000000000 is too large to be in degrees and thus assumed to be in meters
grdsample [WARNING]: (y_max-y_min) must equal (NY + eps) * y_inc), where NY is an integer and |eps| <= 0.0001.
grdsample (gmtapi_init_grdheader): Please select compatible -R and -I values
grdsample [WARNING]: Output sampling interval in y exceeds input interval and may lead to aliasing.
grdimage [ERROR]: Must specify one (or three [deprecated]) input file(s)
gmtmath [ERROR]: Operation "ADD" requires 2 operands
[...]

Also, for some reason the basemap for Antarctica doesn’t display the annotation…

[update : I’m downloading 2013, 2014 and 2015 to have a longer animation with a higher frame rate]

1 Like

@pwessel

Longer version (2013 - 2016) :

Script :

(someone more seasoned should review it for improvement, especially :

  • the “cp + chmod” in include.sh)
  • the list creation in pre.sh
  • the file management (download - unzip - sort)
  • add the -W option to work in a more adapted directory
  • maybe add the screen command (I use it but it’s not in the script)?
    …
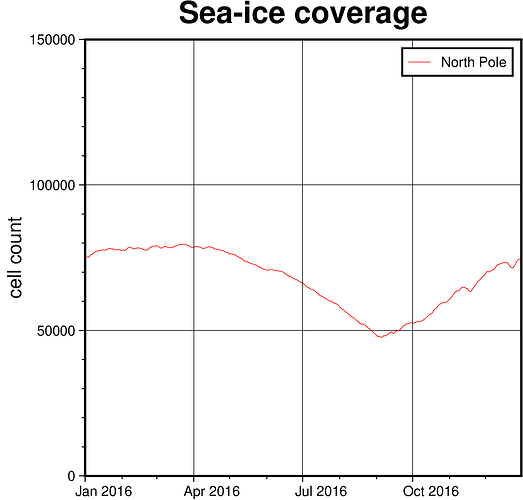
  • I was also thinking about adding a graph at the bottom showing the sea-ice coverage as a function of time … If someone is motivated enough to implement that :slight_smile:

poles_movie.sh.txt (11.9 KB) [remove .txt extension]]

(nota : the video is nicer at 0.5x speed…)

1 Like

Thanks @PlanetGus I will have a look as soon as I can. I am also having some issues with 24 cores when movie launches jogs that deal with curl…

Regarding the “ice-coverage” plot I mentioned adding …
Do you have a more clever use of grdmath ? Creating a 2-D grid for 1 value doesn’t seem efficient.

projection_north='-Js0/90/77/1:93300000'
region_north='-R0/360/50/90'

for ff in $(ls -v data/*nc);
do 

dd=$(ls ${ff} | awk -F[_.] '{print $2}')
gmt grdproject $projection_north $region_north ${ff}?ice_conc -Gdata_bis.nc -C -I -Fk
gmt grdmath data_bis.nc 1 GE SUM  = tmp.nc
gmt math -Q tmp.nc?z[0] = | awk -v day=${dd} 'NR==1 {print day,$0}' >> x.txt
done

gmt begin ice_cov png 
    gmt plot -R2016-01-01T/2016-12-31T/0/150000 -JX10cT/10c x.txt -Wred --FORMAT_DATE_IN=yyyymmdd -B+t"Sea-ice coverage" -l"North Pole" -Bxafg -Byafg+l"cell count"
gmt end show

(Also, converting cell count to km^2 could be a nice thing to do)

Sorry for not following up - will soon - but swamped with a few things.

I am not sure if a follow. I think that you use AREA (in grdmath) to calculate the surface of the ice-coverage from the grid.

That’s what I thought … but the command doesn’t work for some reason (maybe because AREA is supposed to not take any argument?)

grdmath $region $proj file.nc?slice AREA = output 

the AREA operators places on the stack a grid that contains the actual area represented by each grid node. Typically used to multiply with another grid and then perhaps get weighted sums, etc. So of your other grid is 0 and 1 then MUL them and SUM. The result is a constant grid with that sum.

So … eventually,

you could add this to the current script (in gmt_plotm function, between grdproject and grdsample :

gmt grdmath data_bis.nc 1 GE AREA MUL SUM = tmp.nc
gmt grdinfo tmp.nc -T | awk -F[/] '{print $2}' >> sea_ice_cover.txt
-or-
gmt math -Q tmp.nc?z[0] = 

(or something like to end up with the graph I showed)