Any way to determine the region for a specified -J projection?

Hi - long time user and huge fan of GMT, with my first question -

I would like to find a way to programmatically determine the visible latitude and longitude range for a map where the visible map area can be adequately specified using the -J command only. For example, in the following command I use a global data region, but I could actually use a much smaller data region if I knew the visible extent:

gmt pscoast -JS130/0/40/5i -Di -W -Rg -Bxaf -Byaf > map.ps

I want to be able to take a given -J command like above, infer the adequate -R, and then clip a dataset like a grid to that -R in order to minimize the size of the files I’m working with. This problem also applies for maps where the final map edges don’t follow meridians or parallels, like a rectangular map in a UTM projection.

I have tried things like using gmt psbasemap -A to write out the map boundary, but this doesn’t work for circular maps because the rectangular edge is undefined (NaN) and is not the same as the map boundary.

I can -kind of- make it work with a hack, using pscoast -M to export visible coastline lon/lat coordinates and then using awk to get their range - but that won’t work for maps over sea only, for instance.

Is there any way to export the drawn map edge directly in geographic coordinates, or is there a different way to determine the smallest -R data region sufficient to cover the visible map for these types of maps? I’m stumped.

Thanks for any help! - Kyle

You can use grdcut -R -J to extract the smallest w/e/s/n subset that works.

Hi Paul, thanks for the reply. I hadn’t thought to use grdcut to find the minimum domain.

However, I can’t get it to work! Using -J doesn’t seem to change the bounding box of the output grid if I specify -R, and if I don’t specify -R then I have to give either -Z or -S, or else I get an error.

kmbp:gmttest kylebradley$ gmt --version
6.1.1

kmbp:gmttest$ gmt grdcut @earth_relief_01d_p -Gglobaldem.nc -R-180/180/-90/90

kmbp:gmttest$ gmt grdinfo globaldem.nc

globaldem.nc: Title: Produced by grdcut
globaldem.nc: Command: grdcut @earth_relief_01d_p -Gglobaldem.nc -R-180/180/-90/90
globaldem.nc: Remark: Obtained by Gaussian Cartesian filtering (111.2 km fullwidth) from SRTM15+V2.1.nc [Tozer et al., 2019; http://dx.doi.org/10.1029/2019EA000658]
globaldem.nc: Pixel node registration used [Geographic grid]
globaldem.nc: Grid file format: nf = GMT netCDF format (32-bit float), CF-1.7
globaldem.nc: x_min: -180 x_max: 180 x_inc: 1 name: longitude n_columns: 360
globaldem.nc: y_min: -90 y_max: 90 y_inc: 1 name: latitude n_rows: 180
globaldem.nc: z_min: -8182 z_max: 5651.5 name: elevation (m)
globaldem.nc: scale_factor: 1 add_offset: 0
globaldem.nc: format: netCDF-4 chunk_size: 180,180 shuffle: on deflation_level: 3

First, just clip the grid without -JS. I chose a domain larger than needed.

kmbp:gmttest$ gmt grdcut -R90/170/-40/40 globaldem.nc -Goutput1.nc

kmbp:gmttest$ gmt grdinfo output1.nc

output1.nc: Title: Produced by grdcut
output1.nc: Command: grdcut -R90/170/-40/40 globaldem.nc -Goutput1.nc
output1.nc: Remark: Obtained by Gaussian Cartesian filtering (111.2 km fullwidth) from SRTM15+V2.1.nc [Tozer et al., 2019; http://dx.doi.org/10.1029/2019EA000658]
output1.nc: Pixel node registration used [Geographic grid]
output1.nc: Grid file format: nf = GMT netCDF format (32-bit float), CF-1.7
output1.nc: x_min: 90 x_max: 170 x_inc: 1 name: longitude n_columns: 80
output1.nc: y_min: -40 y_max: 40 y_inc: 1 name: latitude n_rows: 80
output1.nc: z_min: -8182 z_max: 5208.5 name: elevation (m)
output1.nc: scale_factor: 1 add_offset: 0
output1.nc: format: classic

Try using -JS:

kmbp:gmttest$ gmt grdcut -JS130/0/30 -R90/170/-40/40 globaldem.nc -Goutput2.nc

kmbp:gmttest$ gmt grdinfo output2.nc

output2.nc: Title: Produced by grdcut
output2.nc: Command: grdcut -JS130/0/30 -R90/170/-40/40 globaldem.nc -Goutput2.nc
output2.nc: Remark: Obtained by Gaussian Cartesian filtering (111.2 km fullwidth) from SRTM15+V2.1.nc [Tozer et al., 2019; http://dx.doi.org/10.1029/2019EA000658]
output2.nc: Pixel node registration used [Geographic grid]
output2.nc: Grid file format: nf = GMT netCDF format (32-bit float), CF-1.7
output2.nc: x_min: 90 x_max: 170 x_inc: 1 name: longitude n_columns: 80
output2.nc: y_min: -40 y_max: 40 y_inc: 1 name: latitude n_rows: 80
output2.nc: z_min: -8182 z_max: 5208.5 name: elevation (m)
output2.nc: scale_factor: 1 add_offset: 0
output2.nc: format: classic

The only difference in the grids is the header text.

kmbp:gmttest$ ls -l output1.nc output2.nc
-rw-r–r-- 1 kylebradley staff 27864 Jul 6 07:18 output1.nc
-rw-r–r--@ 1 kylebradley staff 27876 Jul 6 07:19 output2.nc

Without -R I get this error:

kmbp:gmttest$ gmt grdcut -JS130/0/30 globaldem.nc -Goutput3.nc
grdcut [ERROR]: Must specify only one of the -R, -S or the -Z options

Trying -S with a 30 degree radius gets this:

kmbp:gmttest$ gmt grdcut -JS130/0/30 globaldem.nc -S30d -Goutput4.nc
grdcut [ERROR]: Distance units must be one of d|m|s|e|f|k|M|n|u
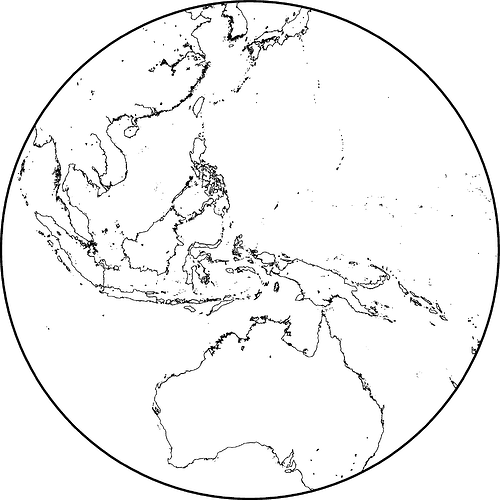
Couple of things: Given your projection center, the hemisphere touches both poles and hence the entire global region is in play.
Second, I tried grdcut -S instead and after fixing a bug (now merged in master) you could use -Slon/lat/90d to simplify the rectangular region, but (again) not for your equator point.

Hi Paul, I understand something now about -JS that led to my confusion. The horizon angle is more optional than the scale, despite coming earlier in the command. I wasn’t clear in my earlier post that I am looking for the minimal region encompassing a stereo plot with a defined horizon angle. I’m also looking for a way to plot the circular boundary of a map like this on an inset map.

So I need to use -JS130/0/30/5i (lon, lat, horizon angle=30, scale=5i) rather than -JS130/0/30 (lon, lat, scale=30, horizon angle=90 by default).

However, grdcut doesn’t seem to honor the horizon angle and returns a global region:

kmbp:gmttest $ gmt grdcut globaldem.nc -Rg -JS130/20/30/5i -Gout.nc

kmbp:gmttest $ gmt grdinfo out.nc
out.nc: Title: Produced by grdcut

out.nc: Grid file format: nf = GMT netCDF format (32-bit float), CF-1.7
out.nc: x_min: 0 x_max: 360 x_inc: 1 name: longitude n_columns: 360
out.nc: y_min: -90 y_max: 90 y_inc: 1 name: latitude n_rows: 180
out.nc: z_min: -8182 z_max: 5651.5 name: elevation (m)

gmt psbasemap -A -JS130/20/30/5i could possibly be used to estimate the map region, but the output boundary is incomplete for this type of map with a lot of NaNs. If the map area encompasses a pole, then it is less useful as you have to keep track of which pole is inside.

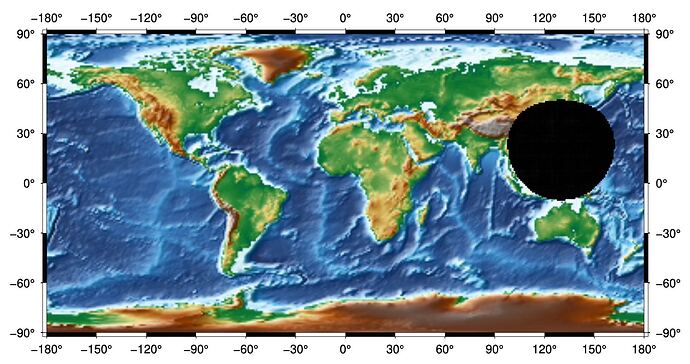
I can estimate the map region using gmtselect on a grid of lon/lat points (image below). But it would be great to have access to the exact map boundary as a closed polygon.

Thanks again!
Kyle

I found the problem bug in grdcut and have posted a PR on GitHub so maybe tomorrow this will work well. Also, -S130/20/30d will work as well for this projection.

Thanks a lot! Much appreciated.

The PR has now been merged so if you can install from git master then you can test it out.