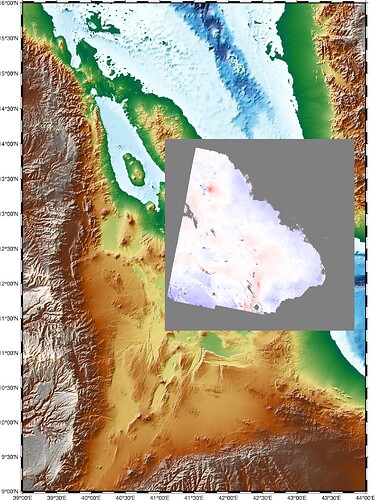
I want to plot .tiff without background color (i already change zeros to NaN) but i get a gray background.in Qgis i can plot it perfectly without any background color (same file).
pygmt.grdinfo(“vel.mskd.geo.tif”) output:
vel.mskd.geo.tif: Title: Grid imported via GDAL
vel.mskd.geo.tif: Command:
vel.mskd.geo.tif: Remark:
vel.mskd.geo.tif: Pixel node registration used [Geographic grid]
vel.mskd.geo.tif: Grid file format: gd = Import/export through GDAL
vel.mskd.geo.tif: x_min: 41.0747778 x_max: 43.8367778 x_inc: 0.001 name: x n_columns: 2762
vel.mskd.geo.tif: y_min: 11.3213333 y_max: 14.0713333 y_inc: 0.001 name: y n_rows: 2750
vel.mskd.geo.tif: v_min: -29.2215118408 v_max: 31.3973579407 name: z
vel.mskd.geo.tif: scale_factor: 1 add_offset: 0
vel.mskd.geo.tif: Default CPT:
+proj=longlat +datum=WGS84 +no_defs
import pandas as pd
import pygmt
grid = pygmt.datasets.load_earth_relief(resolution=“15s”, region=[39,44,9,16])
#Mapas GMT
KWARGS = dict(grid=grid,region=[39,44,9,16], projection=‘M10i’,cmap=‘geo’, frame=0)
fig = pygmt.Figure()
fig.grdimage(shading=True, **KWARGS) # Add illumination!
fig.coast(shorelines=True,borders=[‘1/0.8p’,‘2/0.1p’], frame=True,map_scale='-68.5/7.0/7.0/200 ',resolution=‘f’)
fig.show()
fig.savefig(‘mecanismos_afar.png’)
Hello @bboudhane,
welcome to the GMT forum  !
!
Thanks for including code in your post, but sofar I can not find the part where you add the .tiff file.
If you use grdimage, maybe the nan_transparent parameter is helfpful for you (please see pygmt.Figure.grdimage — PyGMT)?
- nan_transparent (bool or str) – [+z value][color] Make grid nodes with z = NaN transparent, using the color-masking feature in PostScript Level 3 (the PS device must support PS Level 3). If the input is a grid, use +z to select another grid value than NaN. If input is instead an image, append an alternate color to select another pixel value to be transparent [Default is
"black"].
hello @yvonnefroehlich
Thanks for the reply, so it worked as you said, and this is how I added a TIFF file:
fig.grdimage(grid=“vel.mskd.geo.tif”, projection=“M10i”, nan_transparent=True, cmap=“polar”).
Is there any way to add multiple TIFF files at once, or should I repeat the line above for each TIFF file?
I think it is not possible to pass a list to the grid parameter.
If you only change the TIFF file which you pass to the grid parameter you can do:
for grid in [grid_01, grid_02]:
    fig.grdimage(grid=grid)
If there are additional changes, e.g. using a different colormap, then you have to repeat calling Figure.grdimage for each TIFF file.
it’s possible to iterate over pre-defined lists of data and parameters (colormaps etc) using zip() on the lists.
something like below. can be practical or not, as it adds some complexity.
    colors = ['black','red','']
    datasets = [nans, zeros, nonzeros]
    transparencies = [50,50, 0]
    value_names = ['nans', 'zeros', 'nonzeros']
    for color,transparency,data,value in zip(colors, transparencies, datasets, value_names):
        color = color or 'black'
        fig.plot(region=region, projection=projection,
                 x=data.Lon, y=data.Lat, style="c0.05c",
                 pen=f'0.5p,{color}', transparency=transparency)
        font = f'8p,Helvetica-Oblique,{color}'
        fig.text(region=region, projection=projection,
                 x=data.Lon, y=data.Lat, text=data[value],
                 offset="j2p", justify="MR",
                 font=font, transparency=transparency)
Yep, yes of course you can extend the loop  . But as you mentioned, it can add some complexity to the code.
Hm, using a loop always ends up calling Figure.gridmage for each TIFF file separately (maybe my formulation was a bit imprecise in my prevision commment).
hello @yvonnefroehlich @mkononets
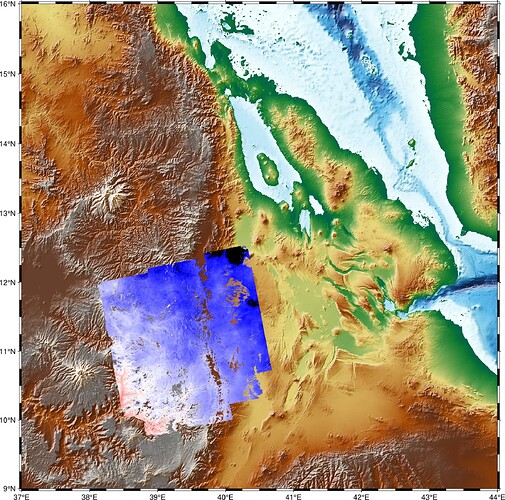
When I force CPT values for the TIFF file using pygmt.makecpt(cmap=“polar”, series= [-40, 40]), I get some strange black areas upper right corner, as shown below (second image). However, if I increase the series range to [-50, 50], the areas appear normally. These areas were originally empty (no information there) (first image).
data range from gdalinfo Min=-64.764 Max=23.367
Both plots look fine. You adjust your cpt and get a better looking plot. This is a normal workflow.
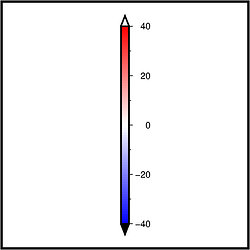
If a dataset contains values exceeding the value range of the created colormap these values can be displayed in a specific color. For the polar colormap, it is black for smaler and white for larger values (default):
import pygmt

size = 5

fig = pygmt.Figure()
fig.basemap(region=[-size, size, -size, size], projection=f"X{size}c", frame=0)

pygmt.makecpt(cmap="polar", series=[-40, 40, 1])
fig.colorbar(cmap=True, position="jMC+e0.2c", frame=True)

fig.show()
Comparing the two plots, the values in the upper right corner of this TIFF file seem to be smaller then -40 but larger then -50.
Here, I am unsure if understand the issue. With “empty” you mean “NaN”? Thus, you expect these areas to appear gray (which is, by default, the NaN color for the polar colormap) or transparent (when using nan_transparent=True within Figure.grdimage)?
you are right, the values in the upper right corner of this TIFF file seem to be smaller then -40 but larger then -50, that why it turns black.
thank you for your help


