Hello everyone
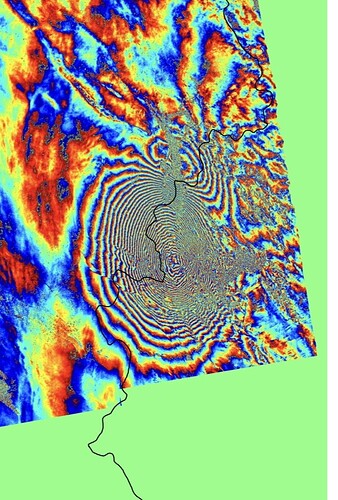
how can I change the background color by gmt
Presumably your INSAR grid has values in your large green areas and that gets painted by your CPT. Typical grid processing should use NaNs outside your data area and then those are mapped to whatever NaN color chosen in the CPT. Or you use grdimage -Q to not paint NaN areas.
So basically there is no background here unless you specify what the nodes are in that area and what they should convert to, or transparent. If transparent then you can paint your area with whatever color you want first via basemap etc.
Can you write the script to illustrate
No, you write a script that shows what you are trying to do and we can comment and help. We have our own work to do you know.
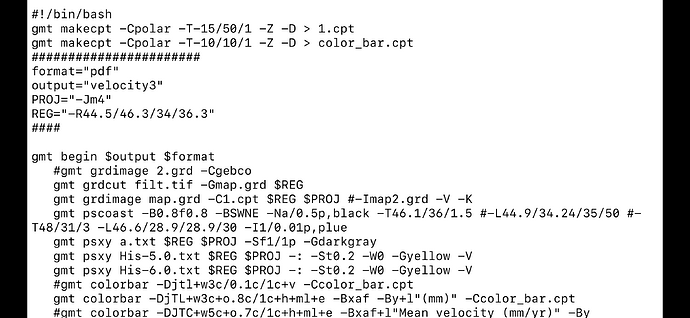
Well, it is an image of a script so useless for anyone to try. Please see how to paste and format code, etc., etc. It is also Sunday so be patient. But it is you who are selecting your colours via makecpt in this case.
Ok🌹
Show us the output of gmt grdinfo map.grd or even that of filt.tif. The presence/number of NaNs is the crucial point here.
filt.tif (795.1 KB)
What I asked was the out put of grdinfo, as in
grdinfo filt.tif
filt.tif: Title: Produced by grdcut
filt.tif: Command: gmt grdcut filt.tif -R45.5/46.5/34/34.5 -Gfilt1.tif
filt.tif: Remark:
filt.tif: Gridline node registration used [Geographic grid]
filt.tif: Grid file format: nf = GMT netCDF format (32-bit float), CF-1.7
filt.tif: x_min: 45.499109249 x_max: 46.4281085151 x_inc: 0.00099999921 name: longitude n_columns: 930
filt.tif: y_min: 34.0009463521 y_max: 34.5009459571 y_inc: 0.00099999921 name: latitude n_rows: 501
filt.tif: v_min: -3.14158701897 v_max: 3.14159107208 name: GDAL Band Number 1
filt.tif: scale_factor: 1 add_offset: 0
filt.tif: format: netCDF-4 chunk_size: 133,167 shuffle: on deflation_level: 3
filt.tif: Default CPT:
GEOGCS["WGS 84",DATUM["WGS_1984",SPHEROID["WGS 84",6378137,298.257223563,AUTHORITY["EPSG","7030"]],AUTHORITY["EPSG","6326"]],PRIMEM["Greenwich",0],UNIT["degree",0.0174532925199433,AUTHORITY["EPSG","9122"]],AXIS["Latitude",NORTH],AXIS["Longitude",EAST],AUTHORITY["EPSG","4326"]]
where you can see that your grid has zeros instead of NaNs to represent no data. And zeros get painted green as it should.
Mirone is a good friend of Geophysicists, With its compliments (your file as it should have been created)
filt.zip (751.6 KB)

