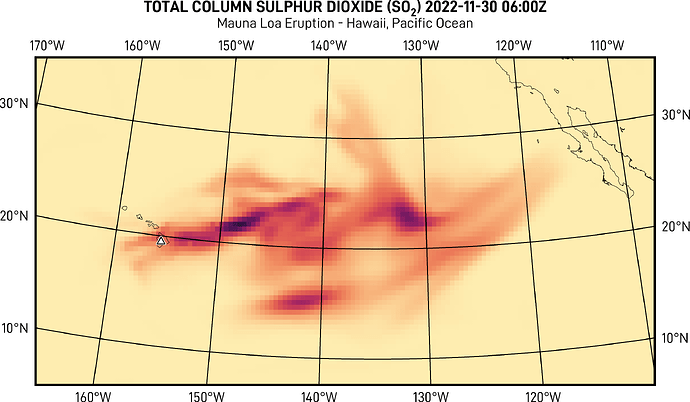
Plotting gridded data in the Hawaii area I wonder if the plot is actually correct or if I’m missing something:
Take a closer look at the N20° parallel. The Lambert Conic Conformal projection makes the parallel bend southwards. When you look at the gridded data, it appears to be oriented parallel to the plot borders and not curved as I expected it:
Green: orientation of gridded data
Blue: I expected the data to bend like the parallel
I’m not sure if I just don’t understand how grdimage works or if I’m missing some option in my grdimage call? Thank you for your help!
Simplified example code:
gmt begin so2_data png
  gmt basemap -R-165/5/-105/35+r -JL-135/22.5/15/25/20c -B+f
  gmt grdimage so2.nc -Ccmocean/matter
  gmt coast -W0.2p,black -Bg10 -A200
gmt end show
Download so2.nc (~1.2 MB)
Attribution: Generated using Copernicus Atmosphere Monitoring Service information 2022

