I create an slope grid and then plotted it.
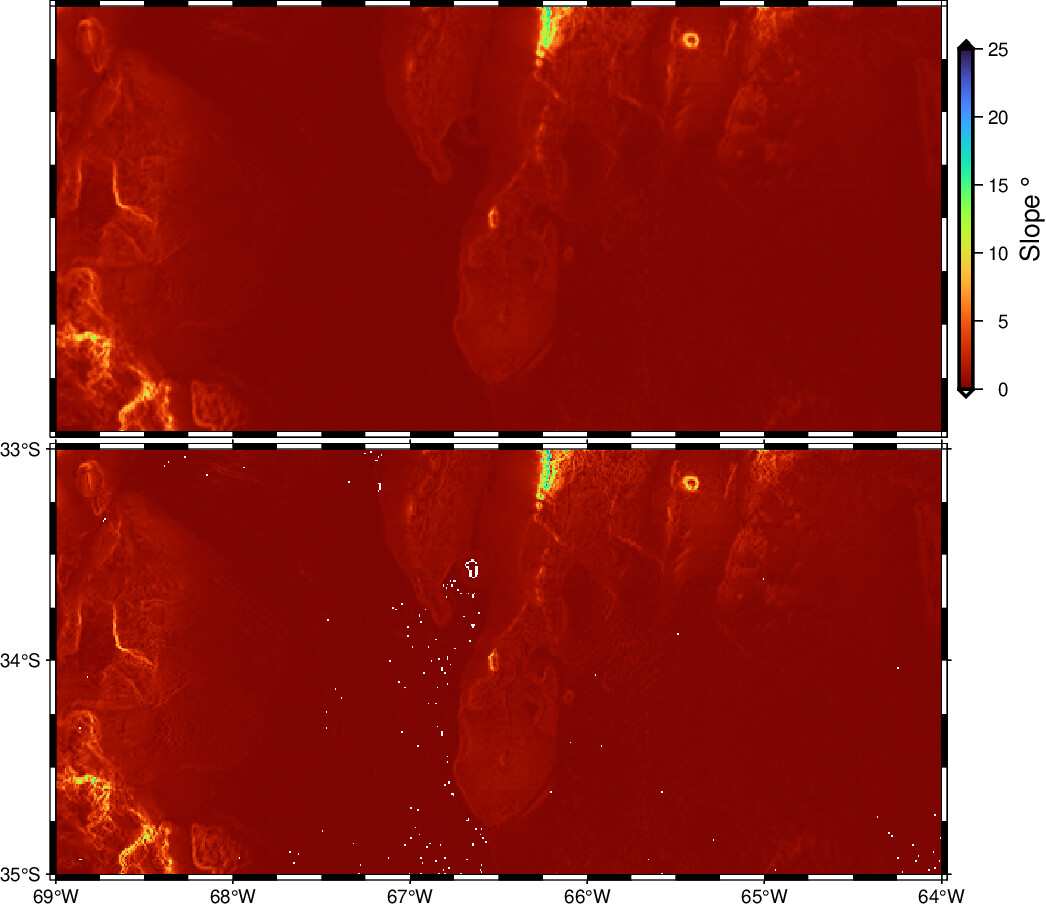
I don’t understand why in the image below I get those white areas. They disappear if I remove -C from grdimage (or if I use a cartesian projection -JX). Is it a bug?
#!/usr/bin/env bash

CUT=tmp_$title.nc

gmt begin BUG_Slope png E150
	gmt grdcut @earth_relief_30s -G$CUT -R-69/-64/-35/-33
	gmt grdgradient $CUT -D -S$CUT -fg
	gmt grdmath $CUT ATAN R2D = $CUT -fg
	gmt grdinfo $CUT

	gmt makecpt -T0/25 -I
	gmt grdimage $CUT -C -JM15c -Baf
	gmt grdimage $CUT    -JM15c -Bf -Y7.5c
#   gmt grdimage $CUT    -JX15c -Bf -Y7.5c

	gmt colorbar -DJRM+o0.3/0+e -C -Ba+l"Slope @."
gmt end
rm $CUT
See -n+c. Basically, your geographic grid with positive slopes needs to be resampled by a (by default) bicubic interpolator which may produce values outside the range of the original grid (small negative values which ends up being colored white). The +c modifier truncates the grid to the original min/max limits. Or use -nl for bilinear which will not exceed those limits.
It works with -n+c. Now I don’t understand why I have to add -n+c when I add -C. There is no need to do that when I don’t use -C:
	gmt grdimage $CUT -C -JM15c  -n+c
	gmt grdimage $CUT    -JM15c
With -C you get the CPT you created from 0-25 and without perhaps you get a stretched default CPT?
Yes, it seems so. But I didn’t expect that behavior from adding -C.
Maybe I can write something on the grdimage doc page, but basically:
- Once you run makecpt and create a specific CPT its domain will be honored exactly since you gave -C to use it. So the resampling pushes outside and you get the back/foreground colors (white)
- If you give no -C then a default CPT is used (depending on the data) and it is auto-stretched to whatever the range is. It may even have a different back/foreground setting.
- If you give -C with a master table then it should be the same as 2 but different colors.