Is there a way to do clipping in pyGMT same way as in Example 17? (17) Images clipped by coastlines — GMT 6.4.0 documentation?
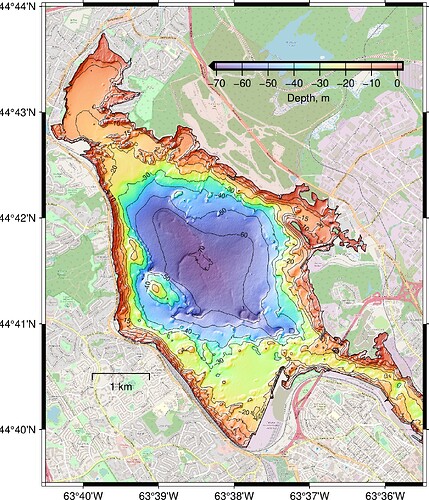
I want to plot tilemap as a background and a hi-res bathymetry grid clipped to OSM land polygon.
I figured I can save the tile map from pyGMT and than plot it using gmt image, but the code looks ugly. Part of my shell code:
PROJ="M4i"
PNG_DPI="1200"

#### generating image from OSM tile map
cat << EOF | python
import contextily
import pygmt
fig = pygmt.Figure()
fig.tilemap(
    region=[$W_DD, $E_DD, $S_DD, $N_DD],
    projection="$PROJ",
    # Set level of details (0-22)
    # Please note, not all zoom levels are always available
    zoom=15,
    # Use tiles from OpenStreetMap tile server
    source="https://{s}.tile.openstreetmap.org/{z}/{x}/{y}.png",
)
fig.savefig("test_pygmt_tilemap.png",dpi=$PNG_DPI)
EOF

gmt begin BB-$(date +%Y-%m-%d) png -C
  gmt psxy -T -J$PROJ -R$W/$S/$E/$N+r
  gmt grd2cpt "$BB_Bathymetry" -Cturbo -Z
#### plotting image from OSM tile map
  gmt image test_pygmt_tilemap.png -DjLB+r$PNG_DPI
  gmt clip "$BB_OSM_LAND_POLY" -bi2f
    gmt grdimage "$BB_Bathymetry" -I+a-45+nt0.75+m0.5 -Q
    gmt grdcontour "$BB_Bathymetry" -L-15/-5 -A5+f"Helvetica,5p" -W0.12,black
    gmt grdcontour "$BB_Bathymetry" -L-72/-20 -A10+f"Helvetica,5p" -W0.12,black
  gmt clip -C
# lots of labeling and text plotting omitted, using bash/awk scripting
gmt end
The result:
