Color by datetime in plot

I’m trying to use PyGMT to plot some earthquakes and color them by their origin time

I have my earthquake catalogue in a Pandas dataframe and the origin time has been converted to a datetime object using:

catalogue['OriginTime'] = pd.to_datetime(catalogue['OriginTime'])

Then making a color pallete using:

pygmt.makecpt(cmap="hawaii", series=[pd.to_datetime("2015-03-03T00:00:00"),pd.to_datetime("2015-03-16T00:00:00"),1000])

Then try to plot using the color option as follows:

color=catalogue.loc['OriginTime']

However, this gives an error that I’m struggling to find a way around:

TypeError: sequence item 0: expected str instance, Timestamp found

I’ve tried converting the time output into a string using:

color=catalogue.loc['OriginTime'].dt.strftime('%Y-%m-%dT%H:%M:%S')

But that gives a similar error of:

TypeError: sequence item 1: expected str instance, float found

Any ideas?
Hmm, you might need to include the time unit in the pygmt.makecpt call. Try something like:

pygmt.makecpt(
    cmap="hawaii",
    series=[
        pd.to_datetime("2015-03-03T00:00:00"),
        pd.to_datetime("2015-03-16T00:00:00"),
        "1d",
    ]
)

which would set an interval of 1 day. See https://docs.generic-mapping-tools.org/6.2/makecpt.html#generate-1d-array for more details (search for TIME_UNIT).

If that doesn’t work, please provide the output of print(df.head()) and your full fig.plot command (copy and paste the text please) so that we can see what’s going on.

No luck with that I’m afraid, here is df.head():

        EventID                       OriginTime  ...  Magnitude  LocationID
0       3217336 2010-01-02 00:58:29.292000+00:00  ...   1.216068          GC
3       3217337 2010-01-02 01:00:50.389000+00:00  ...   1.331515          GC
4       3217344 2010-01-02 01:13:24.555000+00:00  ...   1.344449          GC
5       3217354 2010-01-02 01:34:42.618000+00:00  ...   1.252554          GC
10  2010d000006 2010-01-05 05:28:19.244000+00:00  ...   1.087038          GC

[5 rows x 9 columns]

and here is the full fig.plot command:

pygmt.makecpt(cmap="hawaii", series=[pd.to_datetime("2015-03-03T00:00:00"),pd.to_datetime("2015-03-16T00:00:00"),"1d"])

fig.plot(x=df['Longitude'],
         y=df['Latitude'],
         size=df['Magnitude']/7,
         color=df['OriginTime'].dt.strftime('%Y-%m-%dT%H:%M:%S'), 
         style="cc", pen="black", cmap=True)

Right, so the .dt.strftime is not necessary, it’s actually better to keep preserve the ‘OriginTime’ column in a np.datetime64 dtype because PyGMT can pass that data column to GMT using GMT_DATETIME (don’t worry if that doesn’t make sense). Here’s some sample code (I had to make up some dummy data for some columns):

import numpy as np
import pandas as pd
import pygmt


df = pd.DataFrame(
    data=dict(
        OriginTime=[
            np.datetime64("2010-01-02 00:58:29.292000"),
            np.datetime64("2010-01-02 01:00:50.389000"),
            np.datetime64("2010-01-02 01:13:24.555000"),
            np.datetime64("2010-01-02 01:34:42.618000"),
            np.datetime64("2010-01-05 05:28:19.244000"),
        ],
        Magnitude=[1.216068, 1.331515, 1.344449, 1.252554, 1.087038],
        Longitude=[1, 2, 3, 4, 5],
        Latitude=[6, 7, 8, 9, 10],
    )
)

# %%
fig = pygmt.Figure()
pygmt.makecpt(
    cmap="hawaii",
    series=[
        pd.to_datetime("2010-01-01T00:00:00"),
        pd.to_datetime("2010-01-05T00:00:00"),
        "1d",
    ],
)

fig.plot(
    x=df["Longitude"],
    y=df["Latitude"],
    size=df["Magnitude"] / 7,
    color=df["OriginTime"],
    style="cc",
    pen="black",
    cmap=True,
    frame=True,
    # coltypes="i2T",
)
fig.colorbar()
fig.savefig("datetime_points.png")
fig.show()

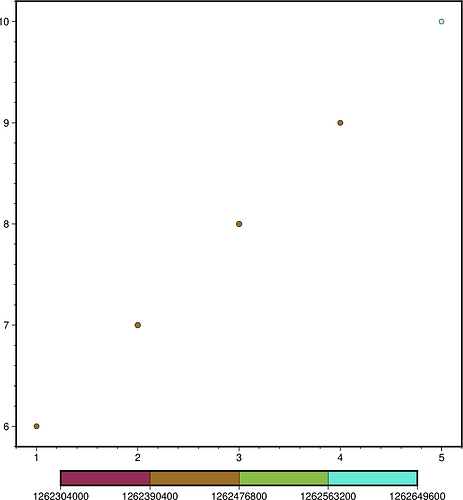
produces:

There’s also a related forum thread at https://flint.soest.hawaii.edu/t/pygmt-pygmt-makecpt-with-dates-times/2141 which you might find helpful. The coltypes parameter should not be needed, unless you pass in the time column as a str dtype, but it’s good to know in case you want to pass in a plaintext data file or something.

Oh, and I’m not quite sure how to get the colorbar to display the actual dates rather than the UNIX format time. Might need to ask another GMT guru for help on this.

1 Like

Did you find any way to display the colorbar with the actual dates?

Could you tell me how I do it.

Thanks.

I found it.
cb = fig.colorbar(frame=“af”)