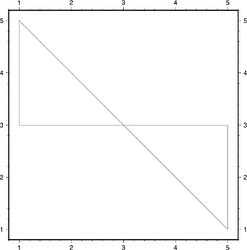
Given an OGR_GMT with a “placename” and “zattribute” consisting of two triangular polygon areas like so:
# @VGMT1.0 @GPOLYGON
# @Nplacename|zattribute
# @Tstring|double
# FEATURE_DATA
>
# @D"Area 1"|0.70
# @P
1 5
1 3
3 3
>
# @D"Area 2"|0.80
# @P
3 3
5 3
5 1
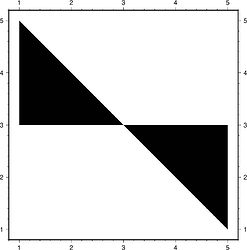
I can plot the polygons ok using gmt plot tmp.gmt -Baf -L -png map:
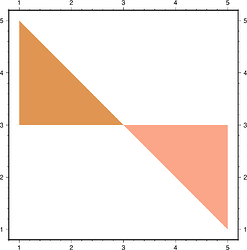
But how can the triangles be colored individually based on the “zattribute” column? I tried looking at the -a (aspatial) column in plot but couldn’t seem to get this to work:
gmt plot tmp.gmt -Baf -L -Cbatlow -G+z -azattribute -png map
# plot [WARNING]: Mismatch between actual (3) and expected (2) fields near line 6 in file
I saw the answers at https://flint.soest.hawaii.edu/t/fill-in-polygon-color/322/4 and https://flint.soest.hawaii.edu/t/coloring-polygon/1026/2, but here I don’t have > -Z0.7 in the multisegment header (difficult to assign it to many polygons at once, but open to ideas of bringing the “zattribute” to the > -Z header if anyone has ideas).


