Hi all, I am having trouble filling in polygons using PyGMT. I have been looking at a previous post “PyGMT: Coloring polygons from a converted kml file”, but those instructions are still not working for me.
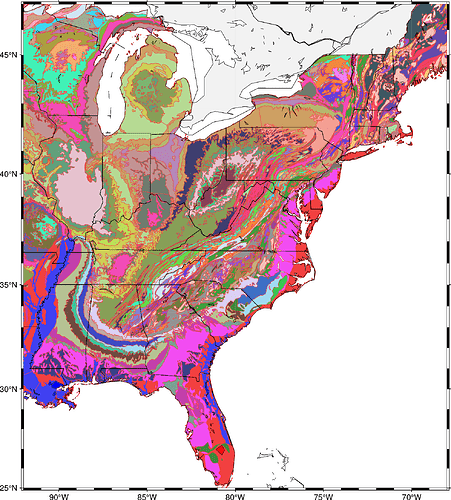
I am trying to plot and color polygons that represent geologic units on a map covering the eastern US. The polygons are from a file named ‘kbge.shp’ from a zipped dataset I downloaded from the USGS: Geology of the conterminous United States(zipped%20shapefile%2014
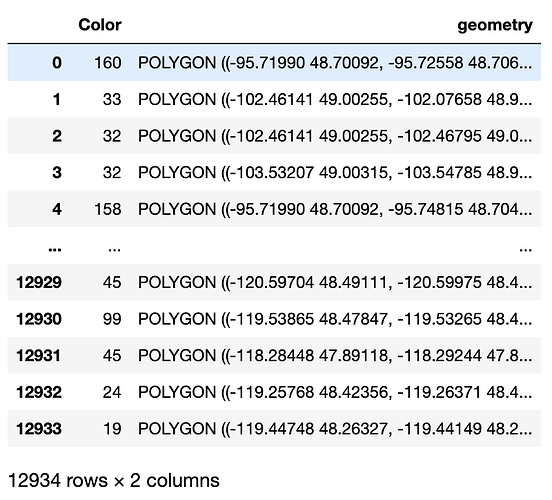
The file ‘kbge.shp’ contains many headers once imported to GeoPandas, but I rename a column and clean it up to only use what I need. The dataframe looks like this:
Beneath is the code that I am running:
import pygmt
import geopandas as gpd

#Read in the shapefile
geol = gpd.read_file('kbge.shp')
geol.rename(columns={'ORDER_': 'Color'}, inplace=True)
geology = geol[['Color', 'geometry']].copy()
geology.to_file('USA_geology.gmt', layer='geometry', driver='OGR_GMT')
#
region = [-92,-68,25,47]
proj = "M20c"

fig = pygmt.Figure()
fig.basemap(region=region, projection=proj, frame=True)
pygmt.makecpt(cmap='categorical', continuous=False, series=[geology.Color.min(),geology.Color.max(),1])

fig.plot(data='USA_geology.gmt', pen='0.2p,black',cmap=True, close=True, fill='+z', aspatial='Z=Color')

fig.coast(region=region, land = 'lightgrey', resolution='l', transparency = 70)
fig.coast(resolution='l', borders = 'a', shorelines='0.2')
fig.show()
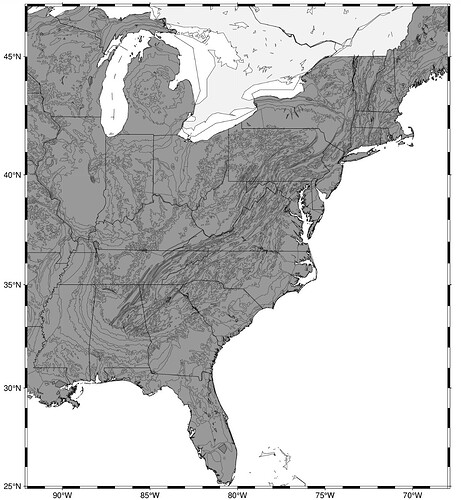
The code runs and plots the outlines of the polygons, but they are all colored grey. The following is the map that the code produces:
I cannot find the issue with the code. Does someone know what am I doing wrong or where the issue could be? I would greatly appreciate your help. Thank you!


