Colormap not showing up on map:

Hi all,

I’ve made progress with the map, but now the colormap won’t apply to there region. I’m not sure why. grdcut does not take cmap as an input, which leaves feeding my cpt into grdimage.

I did make sure that the epoch chosen has data showing for the region specified (Washington state) – so I know there should be something being displayed.

As requested, I adjusted my code so that my problem is reproducible. I don’t know how to share it on Juliahub, but I did make it public, which can be found here where my username is robfuller924. I uploaded 7 files in total. 6 .grd files, and 1 cpt.

Here is the code I’m trying to make the plots with:

using DelimitedFiles, Glob, GMT

begin
    # rad
    twosigrad = GMT.gmtread("/home/rob/RNI/RNI.rad/value/rad.out/2sig/2003.906_rad.grd")
    sigrad = GMT.gmtread("/home/rob/RNI/RNI.rad/value/rad.out/sig/2003.906_rad.grd")

    # lon
    twosiglon = GMT.gmtread("/home/rob/RNI/RNI.lon/value/lon.out/2sig/2003.906_lon.grd")
    siglon = GMT.gmtread("/home/rob/RNI/RNI.lon/value/lon.out/sig/2003.906_lon.grd")

    # lat
    twosiglat = GMT.gmtread("/home/rob/RNI/RNI.lat/value/lat.out/2sig/2003.906_lat.grd")
    siglat = GMT.gmtread("/home/rob/RNI/RNI.lat/value/lat.out/sig/2003.906_lat.grd")

    # cpt
    roma = gmtread("/home/rob/Scripts/cpt/customroma4.cpt")
end

begin
    GMT.subplot(grid = "2x3", title = "RNI | 2003.906"); 

        coast = GMT.coast(DCW = (name = "US.WA"), dump = true);    
        # rad
        G1 = GMT.grdcut(sigrad, cutline=(polygon = coast, crop2cutline= true));
        G2 = GMT.grdcut(twosigrad, cutline=(polygon = coast, crop2cutline= true));

        GMT.grdimage(G1,
            coast = (borders = ((type = 1, pen = ("thick", "red")), (type = 2, pen = ("thinner", "lightgrey"))),
                area = 500,
                shore = (:thinnest, :lightgrey)),
            cmap = roma,
            panel = (1,1),
            title = "Vertical"
            );

        GMT.grdimage(G2,
            coast = (borders = ((type = 1, pen = ("thick", "red")), (type = 2, pen = ("thinner", "lightgrey"))),
                area = 500,
                shore = (:thinnest, :lightgrey)),
            cmap = roma,
            panel = (2,1)
            );

        # lon
        G3 = GMT.grdcut(siglon, cutline=(polygon = coast, crop2cutline= true));
        G4 = GMT.grdcut(twosiglon, cutline=(polygon = coast, crop2cutline= true));

        GMT.grdimage(G3,
            coast = (borders = ((type = 1, pen = ("thick", "red")), (type = 2, pen = ("thinner", "lightgrey"))),
                area = 500,
                shore = (:thinnest, :lightgrey)),
            cmap = roma,
            panel = (1,2),
            title = "East"
            );

        GMT.grdimage(G4,
            coast = (borders = ((type = 1, pen = ("thick", "red")), (type = 2, pen = ("thinner", "lightgrey"))),
                area = 500,
                shore = (:thinnest, :lightgrey)),
            cmap = roma,
            panel = (2,2),
            title = "Greater than 2sigma"
            );

        # lat
        G5 = GMT.grdcut(siglat, cutline=(polygon = coast, crop2cutline= true));
        G6 = GMT.grdcut(twosiglat, cutline=(polygon = coast, crop2cutline= true));

        GMT.grdimage(G5,
            coast = (borders = ((type = 1, pen = ("thick", "red")), (type = 2, pen = ("thinner", "lightgrey"))),
                area = 500,
                shore = (:thinnest, :lightgrey)),
            cmap = roma,
            panel = (1,3),
            title = "North"
            );

        GMT.grdimage(G6,
            coast = (borders = ((type = 1, pen = ("thick", "red")), (type = 2, pen = ("thinner", "lightgrey"))),
                area = 500,
                shore = (:thinnest, :lightgrey)),
            cmap = roma,
            panel = (2,3)
            );

    subplot(show=true)

end

If you do download the data, all you should have to do is adjust the paths to the datasets.

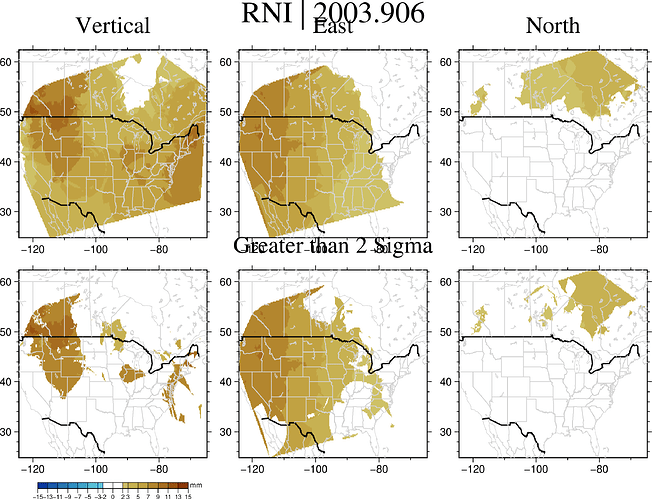
The output of the above code looks like this:

It’s definitely closer to what I want, but, like described above, cmap is not being read in and I’m not sure why.

When I compare this to another script I have, a segment of which, that looks like this:

        # rad
        GMT.grdimage(sigrad, (region= [-130 -70 24 64], proj=:Winkel),
        coast = (borders = ((type = 1, pen = ("thick", "black")), (type = 2, pen = ("thinner", "lightgrey"))),
            area = 500,
            shore = (:thinnest, :lightgrey)),
        cmap = roma,
        panel = (1,1),
        title = "Vertical"
        );

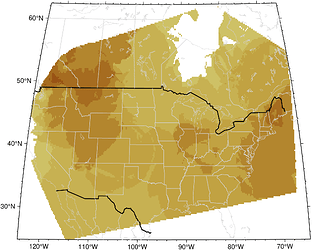
The difference here, is that I specify the region and projection because I’m not using coast or grdcut in the loop that the above segment came from. But cmap does get read in correctly and produced the following:

Where you can see that Washington does have Data for both Vertical and East. So, I’m not sure what’s going on here.

As always, thank you in advance for any help and insights for my technical issues. Please let me know if there are any issues downloading or accessing the data I uploaded to Juliahub. I am happy to share my data through other means as well.

  • Rob :slight_smile:

Okay, the issue appears to be originating from grdcut.

The code here:

coasttest = GMT.coast(DCW = (name = "US.WA"), dump = true);
gridcut = GMT.grdcut(sigrad, cutline=(polygon = coasttest, crop2cutline= true));
GMT.imshow(gridcut, cmap=roma, show=true);

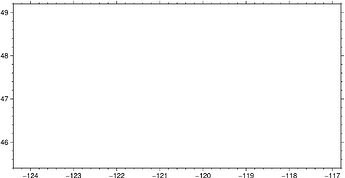
Produced:

While a quick version of grdimage with the following code:

GMT.grdimage(sigrad, proj=:Winkel,
    coast = (borders = ((type = 1, pen = ("thick", "black")), (type = 2, pen = ("thinner", "lightgrey"))),
        area = 500,
        shore = (:thinnest, :lightgrey)),
    cmap=roma, show=true);

produced:

Does anyone have any idea why grdcut is altering or deleting the data? I’m not sure what it’s doing.

bro, I’m so done. Leave it to me to over-complicate a process. Here is all I needed to do to accomplish my desired outcome.

GMT.grdimage(sigrad, proj=:Winkel, limits = (-125, -112, 42, 49),
    coast = (borders = ((type = 1, pen = ("thick", "black")), (type = 2, pen = ("thinner", "lightgrey"))),
        area = 500,
        shore = (:thinnest, :lightgrey)),
    cmap=roma, show=true);

Only needed to specify limits in the grdimage call.

here is what I have, that now contains the PNW, which is what I have been trying to do all week.

I really need to stop over-complicating everything in my life. hahah

  • Rob

Okay, now someone explain to me why a single plot works, but, if I try to use subplot I can no longer create the map?

begin
GMT.subplot(grid = "2x3", title = "RNI | 2003.906"); 

    GMT.grdimage(sigrad, proj = :Winkel, limits = (-125, -112, 42, 49),
        coast = (borders = ((type = 1, pen = ("thick", "black")), (type = 2, pen = ("thinner", "lightgrey"))),
            area = 500,
            shore = (:thinnest, :lightgrey)),
        cmap=roma,
        title = "Vertical");

    GMT.grdimage(twosigrad, proj = :Winkel, limits = (-125, -112, 42, 49),
        coast = (borders = ((type = 1, pen = ("thick", "black")), (type = 2, pen = ("thinner", "lightgrey"))),
            area = 500,
            shore = (:thinnest, :lightgrey)),
        cmap = roma,
        panel = :next
        );

    GMT.grdimage(siglon, proj = :Winkel, limits = (-125, -112, 42, 49),
        coast = (borders = ((type = 1, pen = ("thick", "black")), (type = 2, pen = ("thinner", "lightgrey"))),
            area = 500,
            shore = (:thinnest, :lightgrey)),
        cmap = roma,
        panel = :next,
        title = "East"
        );

    GMT.grdimage(twosiglon, proj = :Winkel, limits = (-125, -112, 42, 49),
        coast = (borders = ((type = 1, pen = ("thick", "black")), (type = 2, pen = ("thinner", "lightgrey"))),
            area = 500,
            shore = (:thinnest, :lightgrey)),
        cmap = roma,
        panel = :next,
        title = "Greater than 2sigma"
        );

    GMT.grdimage(siglat, proj = :Winkel, limits = (-125, -112, 42, 49),
        coast = (borders = ((type = 1, pen = ("thick", "black")), (type = 2, pen = ("thinner", "lightgrey"))),
            area = 500,
            shore = (:thinnest, :lightgrey)),
        cmap = roma,
        panel = :next,
        title = "North"
        );

    GMT.grdimage(twosiglat, proj = :Winkel, limits = (-125, -112, 42, 49),
        coast = (borders = ((type = 1, pen = ("thick", "black")), (type = 2, pen = ("thinner", "lightgrey"))),
            area = 500,
            shore = (:thinnest, :lightgrey)),
        cmap = roma,
        panel = :next
        );
    subplot(:show)
end

Each one of these create the map correctly when not within subplot. But, as soon as I modify it, I get this error:

grdcut [WARNING]: ? not a valid number and may not be decoded properly.
grdcut [ERROR]: Your scale or width (?) resulted in a zero value.
grdcut [ERROR]: Option -J parsing failure. Correct syntax:

  -J Select map proJection (<scale> in cm/degree, <width> in cm). Modifiers:
       +dh Specifying map height.
       +du Specifying maximum map dimension.
       +dl Specifying minimum map dimension.
       +dw Specifying map width [Default].
     Azimuthal projections set -Rg unless polar aspect or -R<...>+r is set.
     -Ja|A<lon0>/<lat0>[/<hor>]/<scl> (or <radius>/<lat>)|<width> (Lambert Azimuthal
       Equal-area)
     -Jb|B<lon0>/<lat0>/<lat1>/<lat2>/<scl>|<width> (Albers Conic Equal-area)
     -Jcyl_stere|Cyl_stere/[<lon0>/[<lat0>/]]<lat1>/<lat2>/<scl>|<width> (Cylindrical
       Stereographic)
     -Jc|C<lon0>/<lat0><scl>|<width> (Cassini)
     -Jd|D<lon0>/<lat0>/<lat1>/<lat2>/<scl>|<width> (Equidistant Conic)
     -Je|E<lon0>/<lat0>[/<horizon>]/<scl> (or <radius>/<lat>)|<width> (Azimuthal
       Equidistant)
     -Jf|F<lon0>/<lat0>[/<horizon>]/<scl> (or <radius>/<lat>)|<width> (Gnomonic)
     -Jg|G<lon0>/<lat0>/<scl> (or <radius>/<lat>)|<width> (Orthographic)
     -Jg|G<lon0>/<lat0>/<scl>|<width>[+a<azimuth>][+t<tilt>][+v<vwidth>/<vheight>]⏎
       …[+w<twist>][+z<altitude>[r|R]|g] (General Perspective)
     -Jh|H[<lon0>/]<scl>|<width> (Hammer-Aitoff)
     -Ji|I[<lon0>/]<scl>|<width> (Sinusoidal)
     -Jj|J[<lon0>/]<scl>|<width> (Miller)
     -Jkf|Kf[<lon0>/]<scl>|<width> (Eckert IV)
     -Jks|Ks[<lon0>/]<scl>|<width> (Eckert VI)
     -Jl|L<lon0>/<lat0>/<lat1>/<lat2>/<scl>|<width> (Lambert Conformal Conic)
     -Jm|M[<lon0>/[<lat0>/]]<scl>|<width> (Mercator)
     -Jn|N[<lon0>/]<scl>|<width> (Robinson projection)
     -Jo|O (Oblique Mercator). Specify one of three definitions:
       -Jo|Oa|A<lon0>/<lat0>/<azimuth>/<scl>|<width>[+v]
       -Jo|Ob|B<lon0>/<lat0>/<lon1>/<lat1>/<scl>|<width>[+v]
       -Jo|Oc|C<lon0>/<lat0>/<lonp>/<latp>/<scl>|<width>[+v]
     -Jpoly|Poly/[<lon0>/[<lat0>/]]<scl>|<width> ((American) Polyconic)
     -Jq|Q[<lon0>/[<lat0>/]]<scl>|<width> (Equidistant Cylindrical)
     -Jr|R[<lon0>/]<scl>|<width> (Winkel Tripel)
     -Js|S<lon0>/<lat0>/[<horizon>/]<scl> (or <slat>/<scl> or <radius>/<lat>)|<width>
       (Stereographic)
     -Jt|T<lon0>/[<lat0>/]<scl>|<width> (Transverse Mercator)
     -Ju|U[<zone>/]<scl>|<width> (UTM)
     -Jv|V<lon0>/<scl>|<width> (van der Grinten)
     -Jw|W<lon0>/<scl>|<width> (Mollweide)
     -Jy|Y[<lon0>/[<lat0>/]]<scl>|<width> (Cylindrical Equal-area)
     -Jp|P<scl>|<width>[+a][+f[e|p|<radius>]][+k<kind>][+r<offset>][+t<origin][+z[p|⏎
       …<radius>]] (Polar [azimuth] (theta,radius)).
     -Jx|X<x-scl>|<width>[d|l|p<power>|t|T][/<y-scl>|<height>[d|l|p<power>|t|T]]
       (Linear, log, and power projections)
     (See basemap for more details on projection syntax)
grdcut [ERROR]: Offending option -JR?

Why would it work individually, but not as a group of maps? It’s the only thing I changed.

but this works?!? y’all I am very confused.

file_count = 1
for i in allrad
    radfile = GMT.gmtread(i)

    base = basename(i)
    yr = string(base[1:8])

    GMT.grdimage(radfile, proj = :Winkel, limits = [-125, -112, 42, 49],
        coast = (borders = ((type = 1, pen = ("thick", "black")), (type = 2, pen = ("thinner", "lightgrey"))),
            area = 500,
        shore = (:thinnest, :lightgrey)),
        cmap = roma,
        title = "Vertical | PNW | $yr",
        savefig = imgpath * lpad(file_count, 4, "0") * ".png"

        );
    file_count += 1
end

That correctly makes all the plots for the one component, that looks like:

Someone please make it make sense to me. Is there some kind of bug with subplot?

I could try it but the grid files you put in juliahub site are in fact 3 column tables in ascii. They may be grided tables bur are not ready to use. (need to be reformatted to nc)

But there is no grdcut in your subplot commands?

weird right? I’m not sure why that’s the error that is showing up. My best guess is from the use of limits? But, that error only shows up if I try to use subplot. My maps work correctly as long as I make each one individually.

As I said above. Can«t test it because your “grids” are ascii tables.