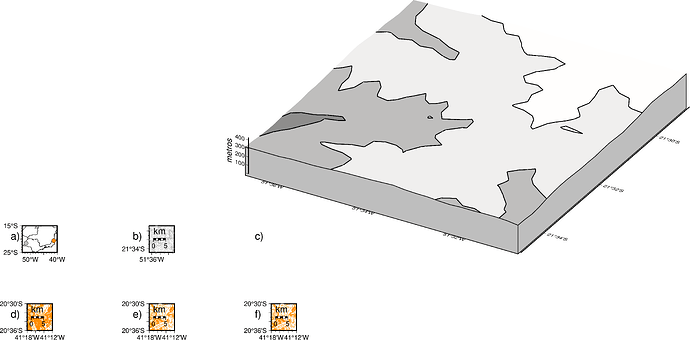
Hi, I am trying to build a subplot figure, but when I try to use a subplot with grdview, it is generating a no proportional sugplot. Here is my code:
import pygmt
import numpy as np
import pandas as pd

delta = 0.1
data = pd.DataFrame([[-51.61, -21.58], [-41.3, -20.6]], columns=["longitude", "latitude"])

fig = pygmt.Figure()
pygmt.config(MAP_FRAME_TYPE = 'plain')
with fig.subplot(nrows=2, ncols=3, figsize=("15c", "5c"),
                 autolabel="+o0.3c", margins="1c"):
    # Activate the first panel so that the colormap created by the makecpt
    # method is a panel-level CPT
    with fig.set_panel(panel=0):
        subset_region = [-53, -40, -25, -15]
        grid_subset = pygmt.datasets.load_earth_relief(resolution="10m", region=subset_region)
        fig.coast(region=subset_region, borders=["1/0.5p,black", "2/0.4p,black", "3/0.5p,blue"],
                  land="white", shorelines="1/0.5p", frame=["xaf", "yaf"])
        fig.plot(x=data.longitude[0], y=data.latitude[0], style="c0.2c", color="grey", pen="black")
        fig.plot(x=data.longitude[1], y=data.latitude[1], style="c0.2c", color="darkorange", pen="black")

    with fig.set_panel(panel=1):
        subset_region2 = [data.longitude[0], data.longitude[0] + delta,
                         data.latitude[0], data.latitude[0] + delta]
        grid_subset2 = pygmt.datasets.load_earth_relief(resolution="15s", region=subset_region2)
        fig.grdcontour(projection="M", interval=10, grid=grid_subset2,
            resample=5, pen=["0.4p", "grey"], )
        fig.grdcontour(projection="M", annotation=r"50+f5p+um+gwhite",
            interval=50, grid=grid_subset2, resample=5,
            pen=["1p", "grey"], label_placement=["d3c"] )
        fig.basemap(map_scale="jBL+w5k+o0.2c/0.5c+f+lkm")

    with fig.set_panel(panel=2):
        subset_region2 = [data.longitude[0], data.longitude[0] + delta,
                         data.latitude[0], data.latitude[0] + delta]
        grid_subset2 = pygmt.datasets.load_earth_relief(resolution="15s", region=subset_region2)
        fig.grdview(
            grid=grid_subset2,
            # Set the azimuth to -130 (230) degrees and the elevation to 30 degrees
            perspective=[150, 30],
            # perspective=[270, 0.1],
            # frame=["xaf", "yaf", "z100+lmetros", "WSnEZ"],
            frame=["xaf", "yaf", "z100+lmetros", "SEZ", ],
            projection="M15c",
            zsize="2c",
            surftype="s",
            # cmap="oleron",
            plane="0+ggrey",
            shading=0,
            # Set the contour pen thickness to "0.1p"
            contourpen="1p",
        )
        # fig.basemap(map_scale="jBL+w1000e+o15c/0.5c+f+lMetros")
        # fig.colorbar(perspective=True, frame=["a50", "x+lElevação", "y+lm"])

    with fig.set_panel(panel=3):
        subset_region3 = [data.longitude[1], data.longitude[1] + delta,
                          data.latitude[1], data.latitude[1] + delta]
        grid_subset3 = pygmt.datasets.load_earth_relief(resolution="15s", region=subset_region3)

        fig.grdcontour(projection="M", interval=40, grid=grid_subset3,
            resample=5, pen=["0.4p", "darkorange"], )
        fig.grdcontour(projection="M", annotation=r"200+f5p+um+gwhite",
            interval=200, grid=grid_subset3, resample=5,
            pen=["1p", "darkorange"], label_placement=["d3c"] )
        fig.basemap(map_scale="jBL+w5k+o0.2c/0.5c+f+lkm")

    with fig.set_panel(panel=4):
        subset_region3 = [data.longitude[1], data.longitude[1] + delta,
                          data.latitude[1], data.latitude[1] + delta]
        grid_subset3 = pygmt.datasets.load_earth_relief(resolution="15s", region=subset_region3)

        fig.grdcontour(projection="M", interval=80, grid=grid_subset3,
            resample=5, pen=["0.4p", "darkorange"], )
        fig.grdcontour(projection="M", annotation=r"400+f5p+um+gwhite",
            interval=400, grid=grid_subset3, resample=5,
            pen=["1p", "darkorange"], label_placement=["d2c"] )
        fig.basemap(map_scale="jBL+w5k+o0.2c/0.5c+f+lkm")

    with fig.set_panel(panel=5):
        subset_region3 = [data.longitude[1], data.longitude[1] + delta,
                          data.latitude[1], data.latitude[1] + delta]
        grid_subset3 = pygmt.datasets.load_earth_relief(resolution="15s", region=subset_region3)

        fig.grdcontour(projection="M", interval=80, grid=grid_subset3,
            resample=5, pen=["0.4p", "darkorange"], )
        fig.grdcontour(projection="M", annotation=r"400+f5p+um+gwhite",
            interval=400, grid=grid_subset3, resample=5,
            pen=["1p", "darkorange"], label_placement=["d2c"] )
        fig.basemap(map_scale="jBL+w5k+o0.2c/0.5c+f+lkm")

fig.show()
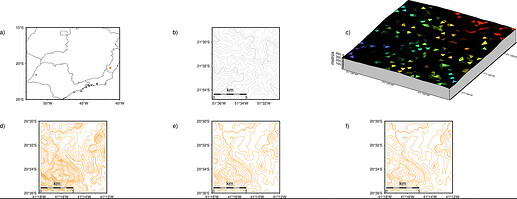
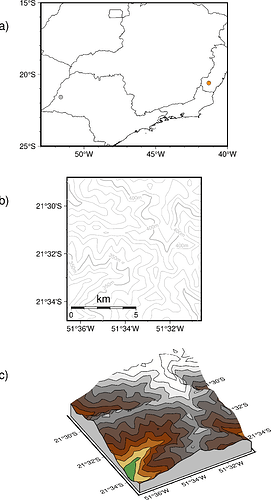
Here is the result:
I would like to know how I could resize “panel=2” Thanks


