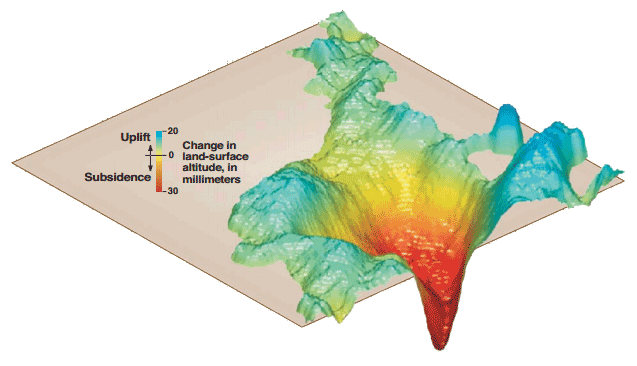
I have grd file with lat, lon and values that denotes the downward vertical motion of land. I want to combine the srtm with grdi files both and get something like following map.

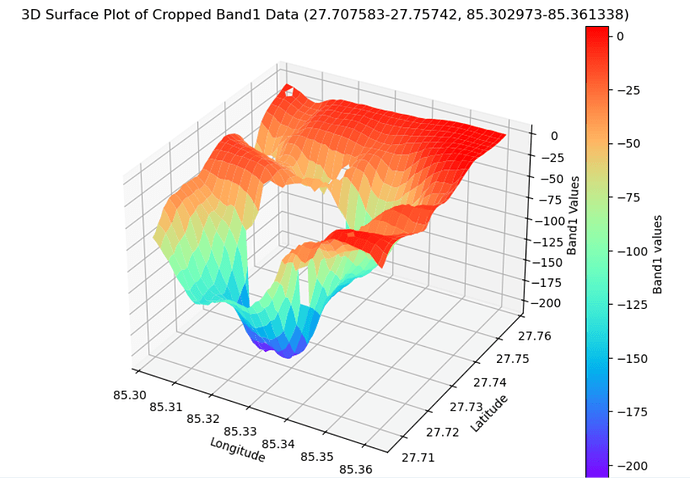
So far i have a simple 3d plot
import matplotlib.pyplot as plt
from mpl_toolkits.mplot3d import Axes3D
import numpy as np

# Load the .grd file using xarray
dataset = xr.open_dataset("subdata/asc.grd")

# Select the 'Band1' variable
data_variable = dataset['Band1']

# Extract the data for lat, lon, and Band1
lat = dataset['lat'].values
lon = dataset['lon'].values
band1_data = dataset['Band1'].values

# Given region boundaries
lon1, lon2 = 85.302973, 85.361338
lat1, lat2 = 27.707583, 27.75742

# Find the nearest index for lat and lon within the specified bounds
lat_idx1 = (np.abs(lat - lat1)).argmin()
lat_idx2 = (np.abs(lat - lat2)).argmin()
lon_idx1 = (np.abs(lon - lon1)).argmin()
lon_idx2 = (np.abs(lon - lon2)).argmin()

# Ensure lat_idx1 < lat_idx2 and lon_idx1 < lon_idx2 for proper slicing
if lat_idx1 > lat_idx2:
    lat_idx1, lat_idx2 = lat_idx2, lat_idx1
if lon_idx1 > lon_idx2:
    lon_idx1, lon_idx2 = lon_idx2, lon_idx1

# Slice the data to crop the region
cropped_lat = lat[lat_idx1:lat_idx2 + 1]
cropped_lon = lon[lon_idx1:lon_idx2 + 1]
cropped_band1_data = band1_data[lat_idx1:lat_idx2 + 1, lon_idx1:lon_idx2 + 1]

# Create a meshgrid for the cropped lat and lon
lon_grid, lat_grid = np.meshgrid(cropped_lon, cropped_lat)

# Enable interactive mode
plt.ion()

# Create the 3D plot for the cropped region
fig = plt.figure(figsize=(10, 7))
ax = fig.add_subplot(111, projection='3d')

# Plot the surface for the cropped region
surface = ax.plot_surface(lon_grid, lat_grid, cropped_band1_data, cmap='rainbow')

# Add labels and title
ax.set_title(f"3D Surface Plot of Cropped Band1 Data ({lat1}-{lat2}, {lon1}-{lon2})")
ax.set_xlabel("Longitude")
ax.set_ylabel("Latitude")
ax.set_zlabel("Band1 Values")

# Add a color bar to show the scale of Band1 values
fig.colorbar(surface, ax=ax, label="Band1 values")

# Show the plot
plt.show()
which creates following image
