Hi, we are starting to migrate over to version 6. We just have version 6.2.0 installed, which is what our computer center installed. But, in my first tests, I am having troubles with the automatic cropping. it seems if i add an axis label, or title, that the cropping goes right through the center of the labels.
for example, i have a time series in the file ‘seismogram.xy’ and I do the following
gmt begin plot jpg
gmt plot seismogram.xy -B+t"just a label"
gmt end show
just trying to understand if this is something I am doing incorrectly, or if this is some other kind of problem. thanks for any advice.
OK, sorry about that. Here is another simple example, completely self-contained:
#!/bin/bash
cat << eof > data.xy
0. 0.
1. 1.
2. 1.
3. 0.5
4. 0.
eof

gmt begin plot2 jpg
  gmt plot data.xy -B+t"just a label" -Bpy0.5+l"amplitude"
gmt end show
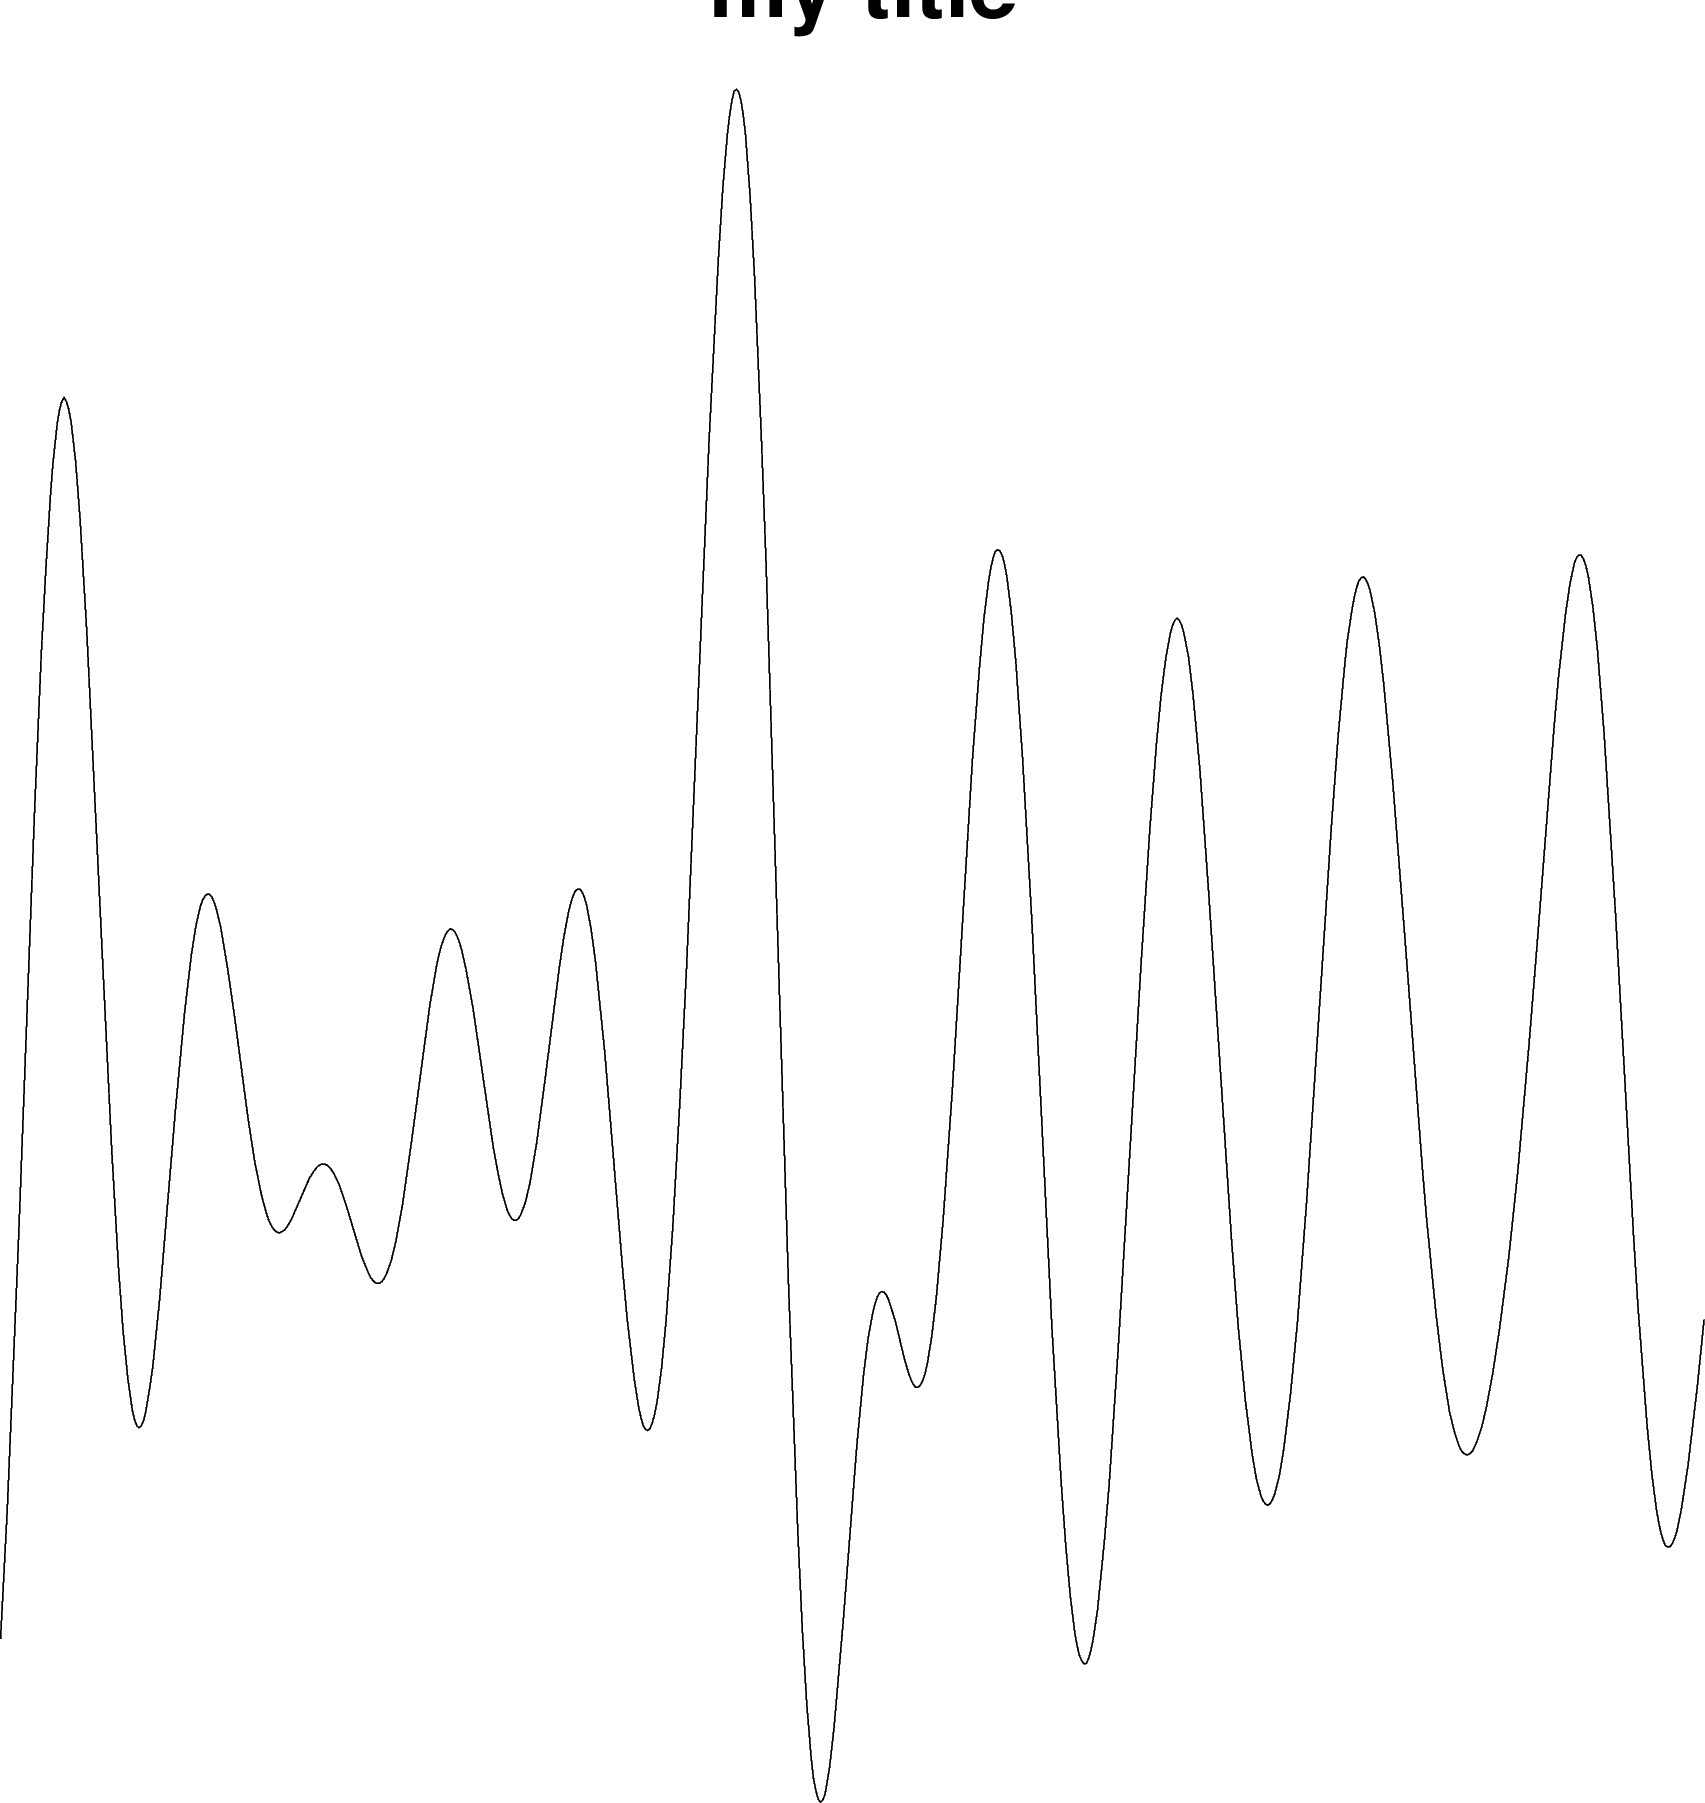
The resulting plot I get is here and is cropped through both the title and the y-axis label
Search for gmt.conf files (local dir or home dir) that may have a PS_MEDIA set to a small size.
You did not say what OS you have so another thing might be you have an old ghostscript version with a bug - many versions have had bugs but the latest 9.55 or 9.56 seems OK. Seeing your cropped plot seemed to remind me of a past gs bug.
Thank you for the suggestions.
We are running Rocky Linux 8, and the ghostscript version is 9.27
I’ll see if I can try a newer ghostscript version.
If I look at the gmt defaults, it says PS_MEDIA is set to a4. But, if I add a line that sets the PS_MEDIA to a4 then I don’t get any cropping at all.
gmt begin plot2 jpg
  gmt set PS_MEDIA a4
  gmt plot data.xy -B+t"just a label" -Bpy0.5+l"amplitude"
gmt end show
Once again, just wanted to thank you for your suggestions.
Updated to ghostscript 9.54.0 (from 9.27) and everything works now as advertised.