I am trying to plot a seismic record section using GMT 5.4.x, my code reads
gmt pswiggle -R0/13/0/450 -Bxcxlabel355.dat+l"Distance (km)" -Bya100fg100+l"Reduced time (s)" -BnWSe
-JX4i/2.22i -Z4i -Wthinnest,black -gy1 -K -X3i seis355.dat -V >$ps``
with my xlabel355.dat file reads
1 a 489
2.5 a 590
4 a 1022
5.5 a 712
7 a 1363
8.5 a 852
10 a 1006
11.5 a 1114
This worked perfectly fine! However, I would like my x-axis annotations to be slanted, and I just discovered GMT 6 has added the +a option on -B so I updated to GMT 6. Then weird things start to happen.
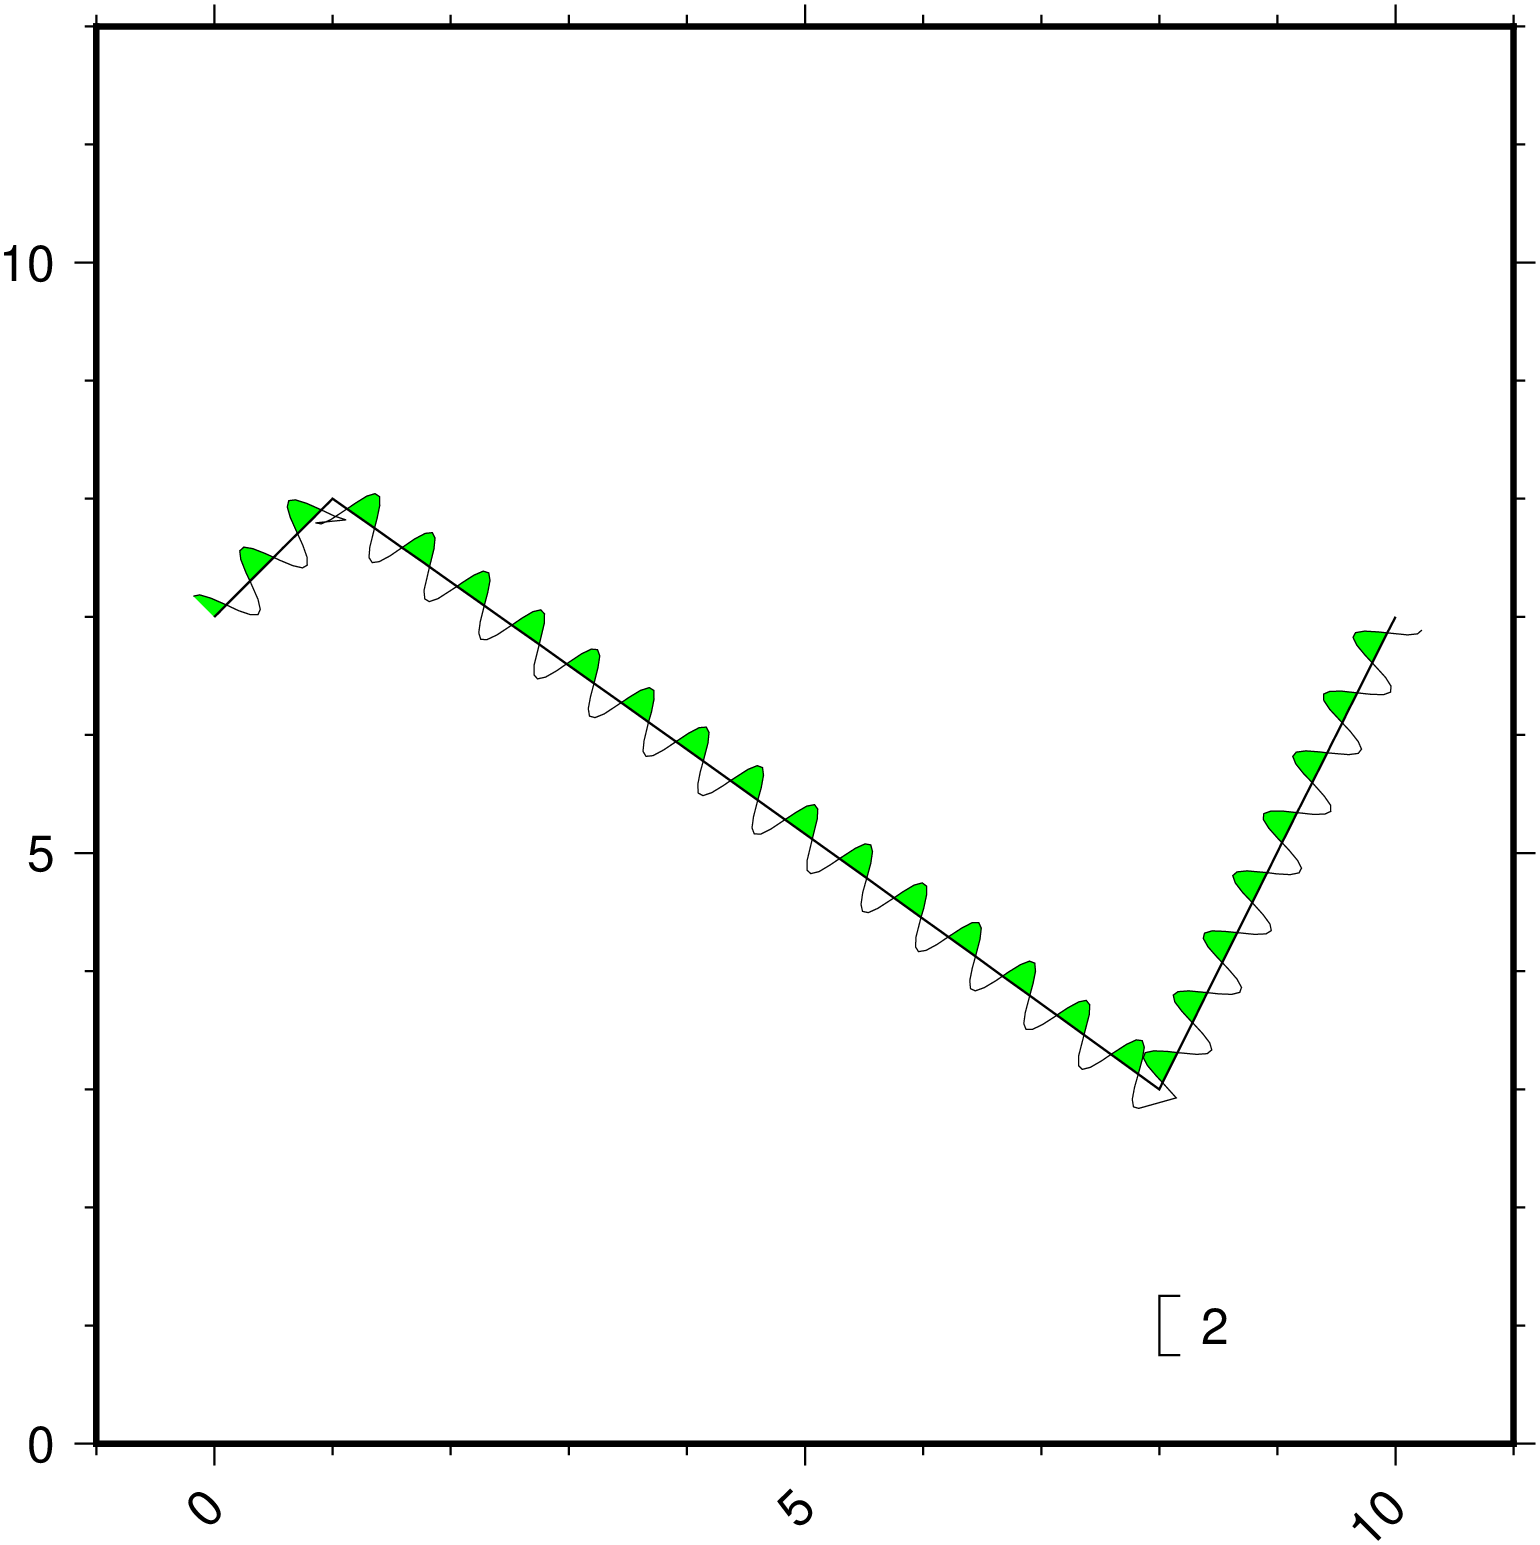
The code above stops working. It runs smoothly, but will plot NO x-axis annotations other than the x-axis title Distance (km). (Fig2)
If I change -Bx to -Bxa1, then the normal annotations will appear fine (Fig 1),
and I have checked the +a option works fine also.
I am really not sure what went wrong here. Really the only thing I changed was updating to GMT 6. Thank you so much for helping!
Don’t know if some bug existed and was fixed meanwhile but works fine with the GMTdev version. And, please use the -A option to psconvert to trim out the white space
psbasemap -R0/13/0/450 -Bxcxlabel355.dat+l"Distance (km)"+a45 -Bya100fg100+l"Reduced time (s)" -BnWSe -JX4i/2.22i > lixo.ps
psconvert lixo.ps -A -Tg
Just tried @Joaquim’s command above with GMT 6.0.0. It works well for me.
Please check if this command works for you. If yes, then you could attach your data files so we can check if it’s an issue of pswiggle.
hey Joaquim and Seisman,
Thank you both for your help. I just tried to used pswiggle in combination with psbasemap and I think everything worked fine (Fig 1)
It seems this could be an issue with pswiggle. I tried to upload my data file but it is too big to upload here. Let me know if you would like me to send it as an email.
Thanks again!
Looks like we do not have considered moving the labels further from the axis when +a is used. Opening an issue on that.
A quick adaptation of one of my julia tests shows that it works for pswiggle (as it should because it calls the same code as psbasemap)
Yes, there is nothing pswiggle-specific here. But we do have a “feature” in the axis offset distance.
Yes, I saw it in first plot. But that’s a PS controlled thing, no? One needs to know the length of the annotations.
The custom annotations do not get plotted regardless if +a is used or not in pswiggle.
If there is nothing pswiggle specific, which I believe could definitely be the case, how can I modify my original code to have plotted everything together (content plus frame) using just one call on pswiggle?
Right now I am plotting the content using pswiggle and the frame using psbasemap.
Thank you!
Can you cut your dataset to just one trace (or part of it), zip it and attach here as well as the full pswiggle command?
partialTrace1.dat.zip (32.5 KB)
Hey Joaquim,
Here is part of my first trace. The pswiggle command I used is:
gmt pswiggle -R0/13/0/450 -Bxcxlabel355.dat+l"Distance (km)" -Bya100fg100+l"Reduced time (s)" -BnWSe
-JX4i/2.22i -Z4i -Wthinnest,black -gy1 -K -X3i seis355.dat -V >$ps
The same as in my original question. Thank you!
@axelwang It turned out to be a bug in pswiggle. Now fixed, see https://github.com/GenericMappingTools/gmt/pull/2976
Thanks for bringing this up
Thank you all for the help and the quick fix. BTW, is there a way to plot two sets of custom labels on either side (top or bottom) of x-axis or left and right of y -axis? Thanks!
If I recall, it is possible that if you give -Bxcfile1 and -Bycfile2 it fails. But you can work around that by placing one of the custom annotions via one module (e.g., pswiggle) and the other via an overlay by psbasemap.