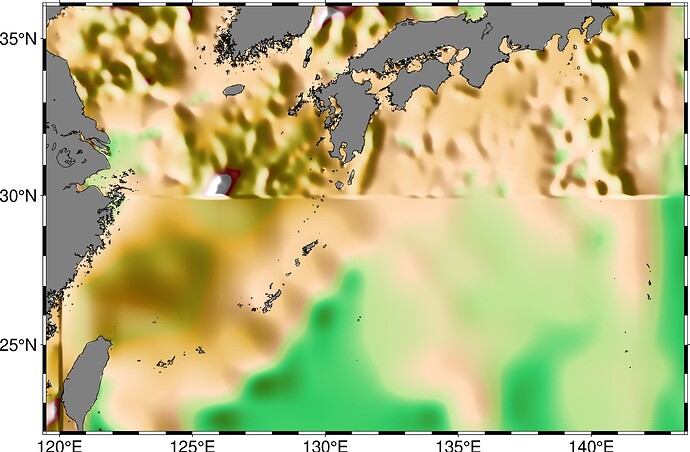
I am trying to plot the sediment thickness dataset which can be accessed here global sediment thickness.
I don’t know why this clipping issue is coming in it. Can anyone helpmeout in this, how to solve this problem?
Here is the code:
fig = pygmt.Figure()
sediment_thickness_file = “/home/GlobSed-v3.nc”
region1 = [119.5, 143.5, 22, 36]
interpolated_grid = pygmt.grdsample(grid=sediment_thickness_file, region=region1, interpolation=“b”, spacing=“0.1m”)
fig.grdimage(grid=interpolated_grid, region=region1, projection=“M20c”, frame=True, cmap=“globe”, shading=“+a600”, verbose=“q”)
fig.coast(resolution=“f”, shorelines=True)
fig.show()
this is the output I am getting"
https://doi.org/10.1029/2018GC008115 see fig 2 caption
Regions inside red dashed polygons indicate sediment thickness values taken from the Laske et al. (2013) grid with an original coarser grid node spacing (1°) than the other used grids.
you happened to hit one such region it seems - if I correctly understood your “clipping issue”.
So, it can not be corrected basically?
Authors wrote their data is at 5 arc min, this region has source data resolution of 1 degree, so the authors likely interpolated it at 5 arc min (they wrote they used gmt for the data preparation). Now you are trying to interpolate it at 10 cm 0.1 arc minute (as indicated by Yvonne below).
I guess it won’t look any better.
1 Like
Just one side comment to avoid confusions, in spacing="0.1m" the unit m means arc minutes not meters (meters would be e). Please see the spacing parameter at https://www.pygmt.org/latest/api/generated/pygmt.grdsample.html:
… Optionally, append an increment unit. Choose among m to indicate arc-minutes or s to indicate arc-seconds. If one of the units e , f , k , M , n or u is appended instead, the increment is assumed to be given in meter, foot, km, mile, nautical mile or US survey foot, respectively, …
1 Like
thanks for the correction. I keep messing up m with meters all the time.
