Hello everyone,
what is a command on the script that i can use to have this result?
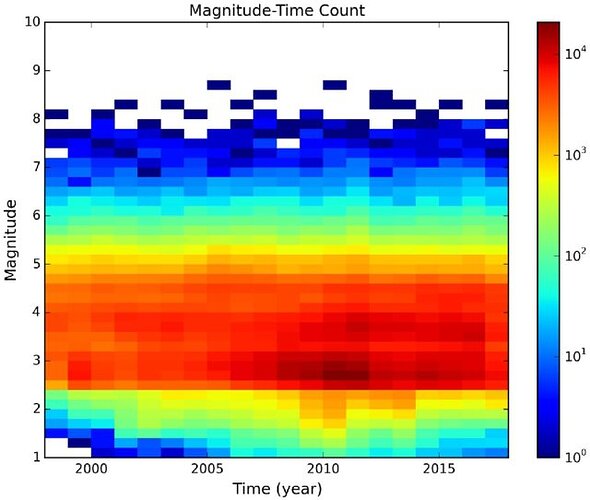
I want to plot a density plot to earthquake and time o for depth, for example.
Thank you for answers.
Hi Anna
It depens on how do you have your data. If its a table then you could use:
gmt blockmean data_table -Sn -C -I$res > tmp_Heatmap.xyz
Here I made a density map (or heatmap) (instead of a profile). The idea is the same.
I’ve been checking out @PlanetGus’s nice heatmap showcase demo that uses xyz2grid -An to get the event counts in each grid cell. In the discussion, gmtbinstats is another recommended module.
Yes, it seems that PlanetGus solution is better. It makes the grid directly.
thanks you!
i will try this solution.
gmt_example.txt (352 Bytes)
this is a example file that i try to use to do a density plot, but it does not work.
i delete other column, for example depth,time.
the coast disappeared. What cant i do? i try to blockmean ecc… and for the exaple of @PlanetGus but i dont understand the second file that you give in gmt match.
It is hard to know without your code or map.
Please read
Are you referring to
The file basin.txt contains the lon/lat coordinates of the Great Basin boundaries in -180(°W)/+180(°E) format. I wanted them in 0/360° format, and I lazily simply added 360 to shift the negative (west) longitudinal coordinates into positive ones (east). But this only works because my values are all west.
At any rate, it’s an optional step that doesn’t concern you much for your case.
gmt begin prova png

    gmt makecpt -Cjet -T0/400.000/10
    gmt coast -R11.50894/15.77485/35.27988/39.50000  -Wthin  -B  -JM5i -Gbeige -Slightblue  -I1
    gmt binstats C:\programs\prova_sicilia_.txt -Gsicilia.nc  -I10km -Tr -Cn -R11.50894/15.77485/35.27988/39.50000
    gmt grdimage sicilia.nc -B -C -R11.50894/15.77485/35.27988/39.50000

gmt end show
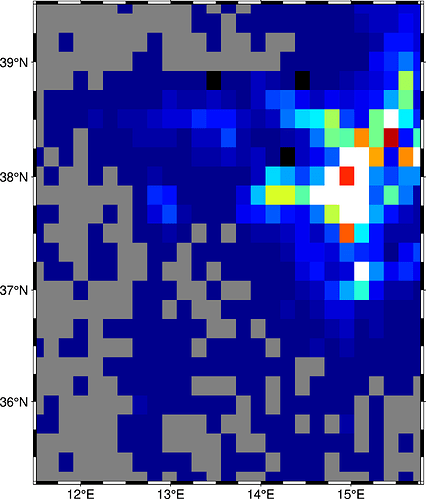
this is my result.
‘’‘’‘’‘’‘’‘’‘’‘’‘’‘’‘’‘’‘’‘’‘’‘’‘’‘’‘’‘’‘’‘’‘’‘’‘’‘’‘’‘’‘’‘’‘’‘’‘’’
i want only the distribution of points and the density of points in area, if it in the maps or graphs. this case i try in the maps.
This is like in bed. If you put the pillow on top of the mobile phone you won’t see it. For that you have to put the mobile on top of the pillow. Here the pillow is the grdimage and the mobile the coast commands.
ok now the coast do not disappear.
This is my now code
‘’’’’’’’’’’’’’’’’’’’’’’’’’’’’’’’’’’’’’’’’’’’’’’’’’’’’’’’’’’’’
gmt begin prova png
gmt xyz2grd C:\programs\prova_sicilia_.txt -Gsicilia.ei+n -I5km -R11.50894/15.77485/35.27988/39.50000 -fg
gmt makecpt -Cjet -T0/400.000/10

gmt grdimage sicilia.ei -B -C -R11.50894/15.77485/35.27988/39.50000
gmt coast -B -R11.50894/15.77485/35.27988/39.50000 -Wthin
gmt end show
‘’’’’’’’’’’’’’’’’’’’’’’’’’’’’’’’’’’’’’’’’’’’’’’’’’’’’’’’’’’’’’’’’’’’’’’’’’’’’’’’’’’’’’’’’’’’’’’’’’’’’’’’’’’’’’’’’’’’
the gmt ask me to give a compatible -R and -I in xyz2grd, why?
now i see only blue in my map.
You may wish to get a grasp of what GMT distance units are expected from the docs. There is no “km” for instance, Since xyz2grd reformats a table into an equidistant grid it is expected that the increment fits inside the given region - hence your messages. Asking for a 5km spacing means GMT will convert that into an equivalent degree interval for your longitude and latitudes and it is unlikely to match exactly.
ok thaks.
now work.
but now do not work the makecpt in grdimage.
I receive a map with only color blu. I try to put -Cjet directly in grdimage and work.
But i want to modify the parameters independently that grdimage.
You might want to use an output file with makecpt
makecpt [...] > mypalette.cpt
[...]
grdimage [...] -Cmypalette.cpt
ok thanks. but i receive the error.
Thanks, but other than that, I didn’t find what I was looking for.
if you want I’ll give you my data resized for a moment.
I simply wanted to make a density plot like the example above. and then I already ask myself the problem of creating grid images, for example showing the number of counts.
This is the given example I have.
Longitude, latitude, depth, magnitude, time.
I would like to use your code, also because once the solution is found I can apply it to all parts of the world that may interest me.prova_GMT.txt (21.2 KB)
See the updated showcase 
really thanks to help me!
My pleasure,
Now you can exercise by changing -Cn by -Cu and see if you get the maximum depth instead of the count of earthquakes. Or -Cs to look at where the highest variability is.
More interesting exercise for you would be to transform the lower panel (lon x depth) into a heatmap too…
I receive this error… i use the same code.
grdimage [WARNING]: Guessing of registration in conflict between x and y, using gridline
grdimage (gmt_api.c:5185(gmtapi_import_grid)): Grid x increment <= 0.0
[Session gmt (0)]: Error returned from GMT API: GMT_RUNTIME_ERROR (79)
[Session gmt (0)]: Error returned from GMT API: GMT_RUNTIME_ERROR (79)
[Session gmt (0)]: Error returned from GMT API: GMT_RUNTIME_ERROR (79)

