This is weird ! Why does it work for some and not for others?
hummm … interesting.
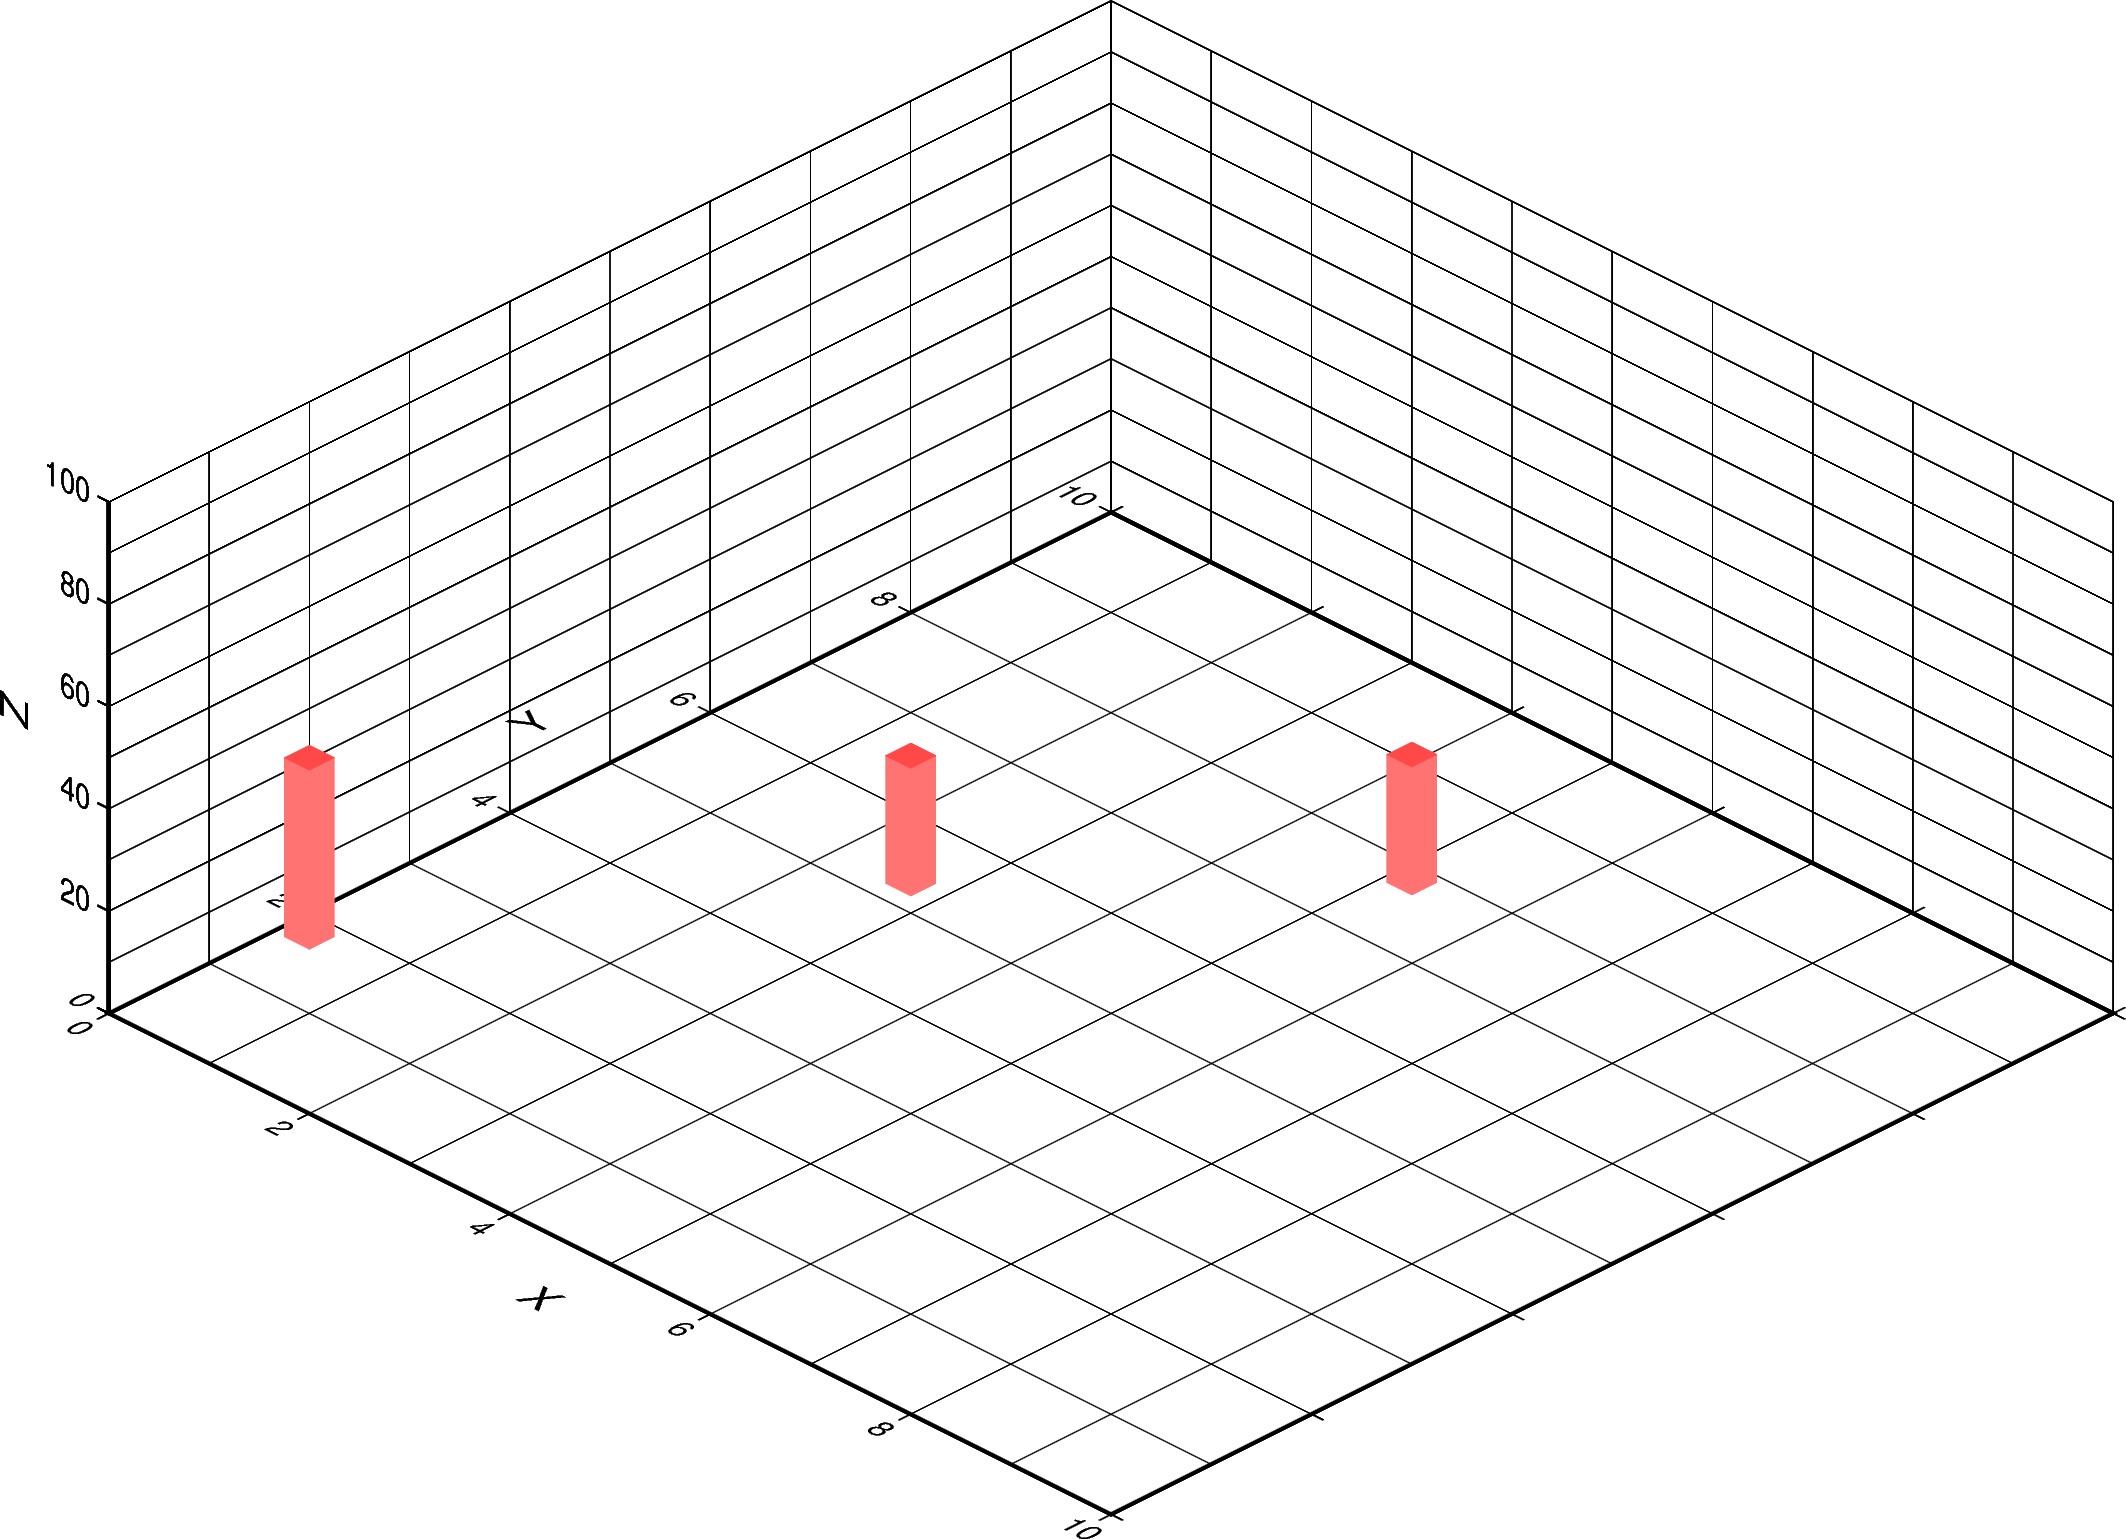
It is actually not clear to me what you are trying to achieve with the style=f'o0.3c+b{df.ztop}'
Is this what you want?
fig.plot3d(data=df[['x', 'y', 'z', "ztop"]],
           style=f'o0.3c+b',
           perspective=True,
           color='red',
           zsize='5c')
1 Like
Wow !! @seisman - you are a Wizard ! This is the way.
Thanks.
I will do some tests here and if works, I’ll mark as a solution.