Differences in PyGMT (windows and linux jupyter)

I was reluctant to open another topic but I found the discussion interesting.

I’m working on a project with several figures made in pygmt. The scripts are on github. After a full weekend with many figures made, I transferred the result to git, and now on Monday I brought it to my Unix environment. The environments are the same, the same packages, the same versions. The only difference is that at home I work with Windows and here at work with Ubuntu 20.04.

To my surprise, several problems appeared. I’m still not sure if it’s with pygmt or pandas (in this example).

A simple test below:

import pandas as pd
import pygmt
import numpy as np

df = pd.DataFrame({'x':[1,5,8],
                   'y':[1,3,5],
                   'zbot':[20,50,60],
                   'ztop':[50,70,80]})
df['z'] = df.zbot-5

region = [0,10,0,10,0,100]

fig = pygmt.Figure()

fig.basemap(region=region,
            perspective=[135,30],
            frame=['xg1a+l"X"','yg1a+l"Y"','zag10+l"Z"','WSenZ'],
            zsize='5c',
            projection='X12c',
        ) 

fig.plot3d(x=df.x,y=df.y,z=df.z,
           style=f'o0.3c+b{df.ztop}',
           perspective=True,
           color='red',
           zsize='5c')

fig.show()

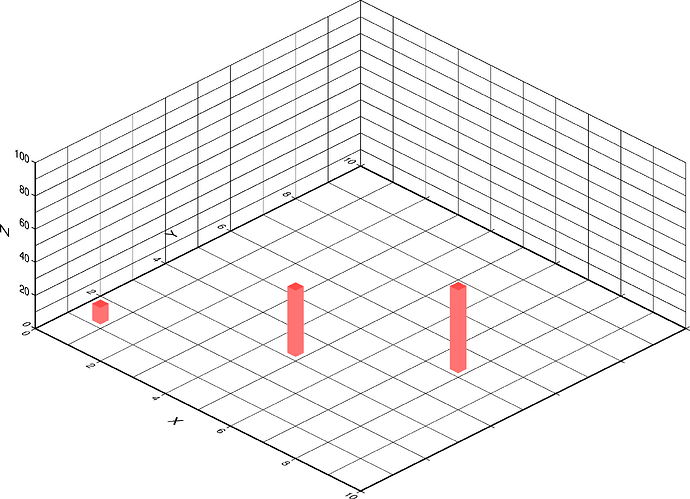
As a result I get this here (but I guarantee that at home, in pygmt installed on windows, it works! I clearly see the figure with the 3 cubes plotted).

plot3d [ERROR]: Cannot find file 50
plot3d [ERROR]: Cannot find file 70
plot3d [ERROR]: Cannot find file 80
plot3d [ERROR]: Cannot find file ztop,
plot3d [ERROR]: Cannot find file dtype:
plot3d [ERROR]: Cannot find file int64

What am I doing wrong?
this code runs without issues in a conda environment with the latest versions of {py}gmt, pandas etc and produces a reasonable figure (those three vertical 3d bars). Base system is Linux Mint 20.2

Thanks @mkononets.
very interesting… may be is something wrong with my environment ?!
What version of pandas and pygmt do you have ?

>>> import pandas as pd
>>> pd.__version__
'1.4.2'
>>> import pygmt
>>> pygmt.__version__
'v0.6.1'

same after upgrading pygmt to 0.7.0, same good after upgrading pandas to 1.4.3

When I’ve had unexplainable problems when juggling between Windows and *nix, it’s often been trouble with newlines. Not sure this is the case here, but nice to know, maybe.

Sometimes crap happens when switching between OS and the type of quote changes.

We spend some two decades fighting that but haven’t heard about it in this millennia.

1 Like

How come? Wont creating/editing a file in e.g. Notepad (i.e. Windows) cause problems in linux and vice versa?

… wait a minute. Is this some Julia trick again?

Nope. We have functions to strip out the “\r\n” and make everything compatible … since before the Clinton administration.

Edit: but I notice how your hypothalamus starts associating Julia with perfection.

1 Like

I have added pygmt.config(GMT_VERBOSE="d") before the fig = pygmt.Figure() line. From the long debug messages, I saw this weird line:

pygmt-session [DEBUG]: GMT_Call_Command string: gmt plot3d @GMTAPI@-S-I-D-V-T-N-000000 -Gred -JZ5c -So0.3c+b0\040\040\040\04050
1\040\040\040\04070
2\040\040\040\04080
Name:\040ztop,\040dtype:\040int64 -p

So, something wrong with your df.ztop:

>>> df.ztop
0    50
1    70
2    80
Name: ztop, dtype: int64

I think you can’t directly pass df.ztop to plot3d.

What is the real implication of this? The 3-bar plot is produced anyway in my case, in spite that extra line is present in the debug messages too.

The plot3d documentation says:

By default, base = 0. Append +bbase to change this value. If base is not appended then we read it from the last input data column.

I think it means only one value can be given to +b. So the long string df.ztop

0    50
1    70
2    80
Name: ztop, dtype: int64

maybe incorrectly interpreted as 0. That’s why the 3-bar plot is plotted.

“I LOVE this group !!” :heart: Thanks @seisman for the quick reply and this showed me the way to test:

So, I brought my computer from home and tested the same program, same environment, on both machines.


On Unix, I have a different answer than yours (@email doesn’t appear) but it doesn’t plot either. On Windows, it works without any problems.

The two debugs are here: Ubuntu debug and Windows debug

Note that on windows it is straight to the point. I actually followed the same steps as @maxrjones showed on Integration with the scientific Python ecosystem 🐍 — Crafting beautiful maps with PyGMT.

Thanks again for the help.

Looks like there is an unnecessary extra comma here after projection='X12c' in the fig.basemap():

fig.basemap(region=region,
            perspective=[135,30],
            frame=['xg1a+l"X"','yg1a+l"Y"','zag10+l"Z"','WSenZ'],
            zsize='5c',
            projection='X12c',
        ) 

Though no idea how this might affect execution of the script or errors shown by fig.plot3d()

No problem. Comma excluded - same problem.
I think plot3d is not parsing the pandas dataframe.

And look: if I change from style=f'o0.3c+b{df.ztop}' to style=f'o0.3c+b5', plot shows up as expected.
So… I bet the problem is parsing the style.

I don’t know if this is the desired result, but

style=f'o0.3c+b{df.ztop}'
style
'o0.3c+b0    50\n1    70\n2    80\nName: ztop, dtype: int64'

as @seisman explained, this style might get interpreted as o0.3c+b0, the rest kind of fits your error list:

plot3d [ERROR]: Cannot find file 50
plot3d [ERROR]: Cannot find file 70
plot3d [ERROR]: Cannot find file 80
plot3d [ERROR]: Cannot find file ztop,
plot3d [ERROR]: Cannot find file dtype:
plot3d [ERROR]: Cannot find file int64

Yes… but why on windows works ? (see at https://www.generic-mapping-tools.org/egu22pygmt/ecosystem.html - it should work with pandas/geopandas).

I think it works on Windows because on Windows, newlines are \r\n, not \n. So \n in the df.ztop string are interpreted as newlines on Linux, but they’re not newlines on Windows.

see at Integration with the scientific Python ecosystem 🐍 — Crafting beautiful maps with PyGMT - it should work with pandas/geopandas.

There are some misunderstanding here. pandas support means you can pass a pandas object to parameters like data, x, y, z, but here you’re actually passing a string representation of a pandas object to PyGMT.

Yes ! but works (in Windows).
One of the solutions I’m trying now is to compose the string via for loop. But it is much slower.
This is a small example but the figure I’m working on has 56927 points. Much slower indeed.

It also works on my Linux machine.
See below the relevant part of the debug log:

pygmt-session [DEBUG]: GMT_Call_Command string: gmt plot3d @GMTAPI@-S-I-D-V-T-N-000000 -Gred -JZ5c -So0.3c+b0\040\040\040\04050
1\040\040\040\04070
2\040\040\040\04080
Name:\040ztop,\040dtype:\040int64 -p
pygmt-session [DEBUG]: Use PS filename /home/mkononets/.gmt/sessions/gmt_session.434215/gmt_1.ps-
pygmt-session [DEBUG]: gmtinit_get_current_panel: No current panel selected so not in subplot mode
pygmt-session [DEBUG]: Modern mode: Added -R to options since history is available [0/10/0/10/0/100].
pygmt-session [DEBUG]: Modern: Adding -J to options since history is available [X12c].
pygmt-session [DEBUG]: Revised options: @GMTAPI@-S-I-D-V-T-N-000000 -Gred -JZ5c -So0.3c+b0\040\040\040\04050 -p -R -J

the style is first

-So0.3c+b0\040\040\040\04050
1\040\040\040\04070
2\040\040\040\04080
Name:\040ztop,\040dtype:\040int64

On the revised options only the first line is left: -So0.3c+b0\040\040\040\04050
and then a plot is produced as if the style was just So0.3c+b0