Dear gurus,
I did my cross-section to plot earthquakes using “project”, basically something like this (sorry about the variables, it is just an example that works using a color “gray” to fill in the symbols):
awk ‘{ if ($4 <= 50) print $3, $2, $4, $5*.075 }’ FS=“,” $usgs | gmtselect $Fgmtselect $fgmtselect | project -C
cat tmp1 | tr ' ' '/'-Ecat tmp2 | tr ' ' '/'-Q -W-85/85 -V | awk ‘{ print $5, $3*-1, $4 }’ | psxy -J -R -Sc -Ggray -W -O >> $ps
My doubt is about a figure I found here: http://earthjay.com/earthquakes/20151126_brazil/polet_jascha_seismicity_peru_cross_section.jpg
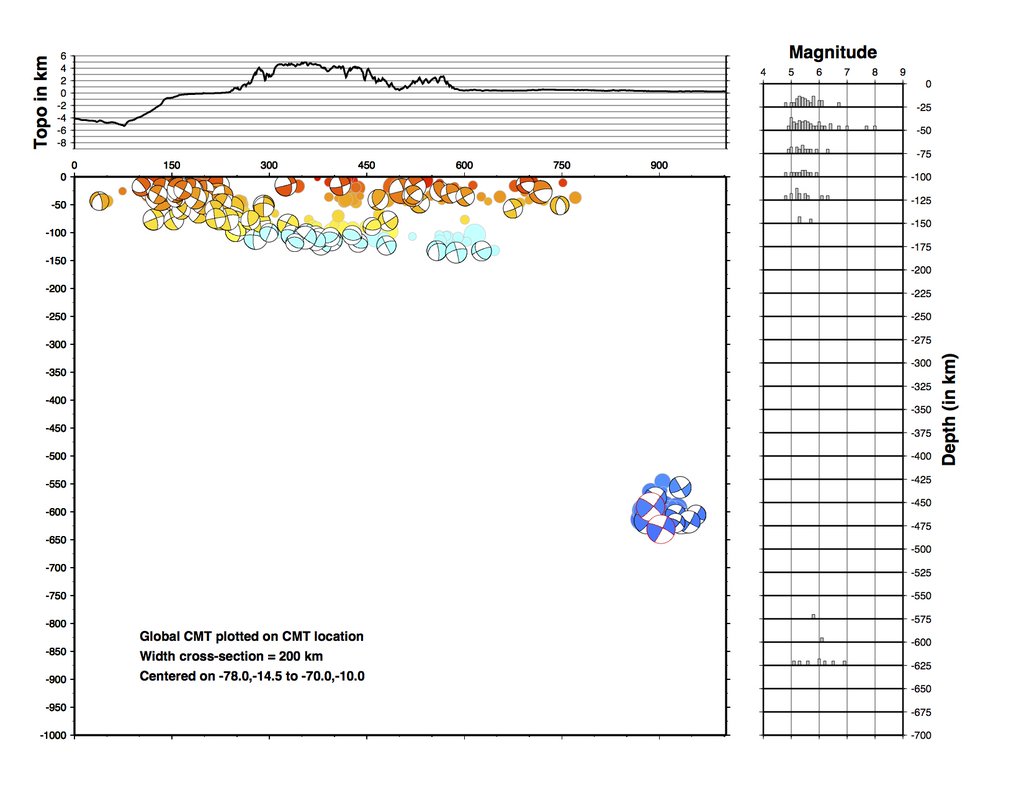
This figure has a warm-to-cold color gradient to plot seismicity with depth (besides its size is based on magnitude). I am wondering if there is a way to use a single psxy call to create this behavior or should I use several psxy calls once seismicity is filtered out by depth (e.g., awk)?
Any support is welcomed,
Best regards,
Gery