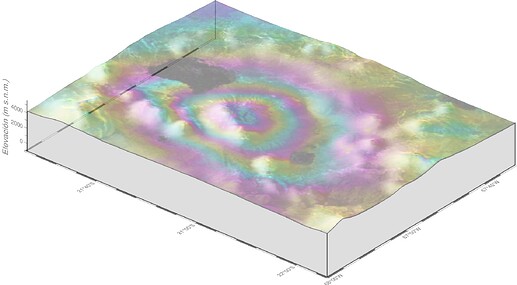
Drape a raster on top of a 3D map in PyGMT

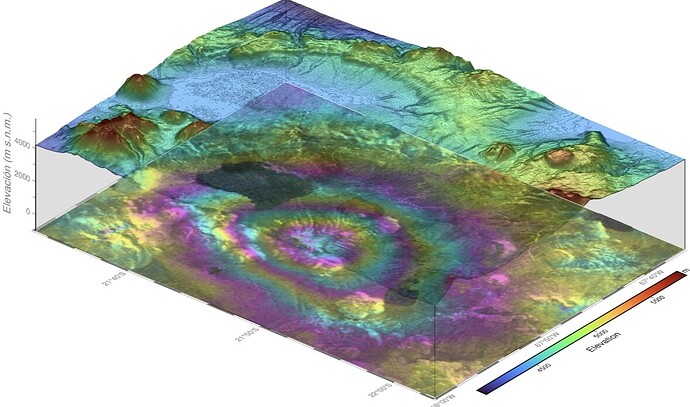
Hey guys, I’ve been trying yo overlay a raster on top a the topography of a 3D model with PyGMT but I can’t make it work, is it even possible?
This is my code:

fig = pygmt.Figure()
fig.grdview(
    grid=grid
    perspective=[-130, 30],
    frame=["nSwWZ", "af", "zaf+lElevación (m s.n.m.)"],
    projection="M15c",
    zsize="5c",
    surftype="s",
    plane="-1000+ggrey",
    contourpen="0.1p",
    transparency=50,
)

fig.grdimage(
    grid="C:/phase3.tif",
    perspective=[-130, 30],
    region=[-68.00, -67.60, -22.05, -21.55],
    transparency=30,
    projection="M15c"
)

fig.colorbar(perspective=True, frame=["a500", "x+lElevation", "y+lm"])
fig.show()

To drape a grid on a surface you use the -G option of grdview, not a second call to grdimage. (must translate this to pygmt).

Thanks! I ve tried that, its called drapegrid in PyGMT but I am getting errors everytime I use that argument I get errors, I’ve tried givin it a raster in .tif, and xarray data array, georeferencedd png and a single channel .nc files and I always get an error.
This is my code:

fig = pygmt.Figure()
fig.grdview(
    grid=grid,
    #drapegrid="filepath.tif",
    drapegrid=phase # is also the file path of the .tif file,
    perspective=[-130, 30],
    frame=["nSwWZ", "af", "zaf+lElevación (m s.n.m.)"],
    projection="M15c",
    zsize="3c",
    surftype="s",
    shading = True,
    plane="-1000+ggrey",
    contourpen="0.1p",
    transparency=50,
)
fig.colorbar(perspective=True, frame=["a500", "x+lElevation", "y+lm"])
fig.show()

And this is the error :slight_smile:

OSError                                   Traceback (most recent call last)
Cell In[18], line 2
      1 fig = pygmt.Figure()
----> 2 fig.grdview(
      3     grid=grid,
      4     #drapegrid="filepath.tif",
      5     drapegrid=phase,
      6     # Set the azimuth to -130 (230) degrees and the elevation to 30 degrees
      7     perspective=[180, 90],
      8     frame=["nSwWZ", "af", "zaf+lElevación (m s.n.m.)"],
      9     projection="M15c",
     10     zsize="3c",
     11     surftype="s",
     12     shading = True,
     13     plane="-1000+ggrey",
     14     # Set the contour pen thickness to "0.1p"
     15     contourpen="0.1p",
     16     transparency=50,
     17 )
     18 fig.colorbar(perspective=True, frame=["a500", "x+lElevation", "y+lm"])
     19 fig.show()

File ~\anaconda3\lib\site-packages\pygmt\helpers\decorators.py:609, in use_alias.<locals>.alias_decorator.<locals>.new_module(*args, **kwargs)
    603     msg = (
    604         "Parameters 'Y' and 'yshift' are no longer supported since v0.12.0. "
    605         "Use Figure.shift_origin(yshift=...) instead."
    606     )
    607     raise GMTInvalidInput(msg)
--> 609 return module_func(*args, **kwargs)

File ~\anaconda3\lib\site-packages\pygmt\helpers\decorators.py:773, in kwargs_to_strings.<locals>.converter.<locals>.new_module(*args, **kwargs)
    770             bound.arguments["kwargs"][arg] = newvalue
    772 # Execute the original function and return its output
--> 773 return module_func(*bound.args, **bound.kwargs)

File ~\anaconda3\lib\site-packages\pygmt\src\grdview.py:155, in grdview(self, grid, **kwargs)
    148 with (
    149     lib.virtualfile_in(check_kind="raster", data=grid) as vingrd,
    150     lib.virtualfile_in(
    151         check_kind="raster", data=kwargs.get("G"), required_data=False
    152     ) as vdrapegrid,
    153 ):
    154     kwargs["G"] = vdrapegrid
--> 155     lib.call_module(
    156         module="grdview", args=build_arg_list(kwargs, infile=vingrd)
    157     )

File ~\anaconda3\lib\site-packages\pygmt\clib\session.py:657, in Session.call_module(self, module, args)
    652 else:
    653     raise GMTInvalidInput(
    654         "'args' must be either a string or a list of strings."
    655     )
--> 657 status = c_call_module(self.session_pointer, module.encode(), mode, argv)
    658 if status != 0:
    659     raise GMTCLibError(
    660         f"Module '{module}' failed with status code {status}:\n{self._error_message}"
    661     )

OSError: exception: access violation reading 0x0000000000000150
Hello @Jasssk8

drapgrid should be the correct parameter to accomplish this via Figure.grdview.

Is it possible for you to share your .tif file? Without it is diffcult for us to reproduce your problem.

Can you please try if it works for you when setting surftype="i" (image plot), instead of surftype="s" (surface plot). (The parameter contourpen in not needed in this case.)

Hello @yvonnefroehlich

I tried setting surftype="i" but stil doesnt work, here its my tif file, and thank you so much for your time :slight_smile:
phase3.tif (437.9 KB)

@Jasssk8 thanks for sharing your tif file.

I just tried a code based on your shared code. For me, it works for surftype="i", but it fails for surftype="s" (this is something I recognised while working on a similar plot). I tested the code on Linux (GMT 6.4.0 + PyGMT v0.11.0) and Windows (GMT 6.5.0 + PyGMT v0.12.0/dev).

import pygmt
# import rioxarray


# Name of tif file
phase = "phase3.tif"

# Load tif file into an xarray.DataArray
# phase_da = rioxarray.open_rasterio(phase)


fig = pygmt.Figure()

fig.grdview(
    grid="@earth_relief_30s_g",
    drapegrid=phase,
    region=[-68.00, -67.60, -22.05, -21.55],
    frame=["nSwWZ", "af", "zaf+lElevación (m s.n.m.)"],
    projection="M15c",
    zsize="3c",
    # surftype="s",  # fails
    surftype="i",  # works
    shading=True,
    plane="-1000+ggrey",
    # contourpen="0.1p",  # not needed for surftype="i"
    transparency=50,
    perspective=[-130, 30],
)

fig.show()

Output figure:

A side comment: After drapping a grid on top of the topography, adding a colorbar for the elevation is no longer meaningful.

well phase3.tif is a georeferenced RGBA image, not a grid.

gmt grdview ... -Gphase3.tif -Qs crashes (-Qc works, -Qi also works):

gmt grdcut @earth_relief -Grelief.nc -Rphase3.tif -JM15c
gmt grdview relief.nc -JM15c -JZ5c -Qs -N-1000+ggrey -Gphase3.tif -p-130/30 -BnSwWZ -Baf -Bzaf -png draped -Vd
...
grdview [DEBUG]: Got session name as draped and default graphics formats as png
grdview [DEBUG]: Basemap order: Frame = below  Grid = below  Tick/Annot = below
grdview [INFORMATION]: Place filled surface
ERROR: Caught signal number 11 (Segmentation fault) at
/home/mkononets/mambaforge/envs/pygmt/bin/../lib/libgmt.so.6(+0x34bea3)[0x7f9c2a16fea3]
[0x150]
Stack backtrace:
/home/mkononets/mambaforge/envs/pygmt/bin/../lib/libgmt.so.6(gmt_sig_handler_unix+0xf0)[0x7f9c29f7b4e0]
/lib/x86_64-linux-gnu/libc.so.6(+0x42520)[0x7f9c29c1a520]
/home/mkononets/mambaforge/envs/pygmt/bin/../lib/libgmt.so.6(+0x34bea3)[0x7f9c2a16fea3]
/home/mkononets/mambaforge/envs/pygmt/bin/../lib/libgmt.so.6(GMT_grdview+0x529d)[0x7f9c2a1779ad]
/home/mkononets/mambaforge/envs/pygmt/bin/../lib/libgmt.so.6(GMT_Call_Module+0x586)[0x7f9c29e7ad06]
gmt(main+0x5d8)[0x561568ce6618]
/lib/x86_64-linux-gnu/libc.so.6(+0x29d90)[0x7f9c29c01d90]
/lib/x86_64-linux-gnu/libc.so.6(__libc_start_main+0x80)[0x7f9c29c01e40]
gmt(+0x32fd)[0x561568ce72fd]

OMG Thank you so much jajajaj It works perfectly now :slight_smile:

I’ve submitted a fix for the crash in #8569, which is basically to check that -C is used with -Qs (the code requires it).

Thanks for the fix and the remark. Good to know.

Thanks a lot @Joaquim for this fix :slightly_smiling_face: !