Hello,
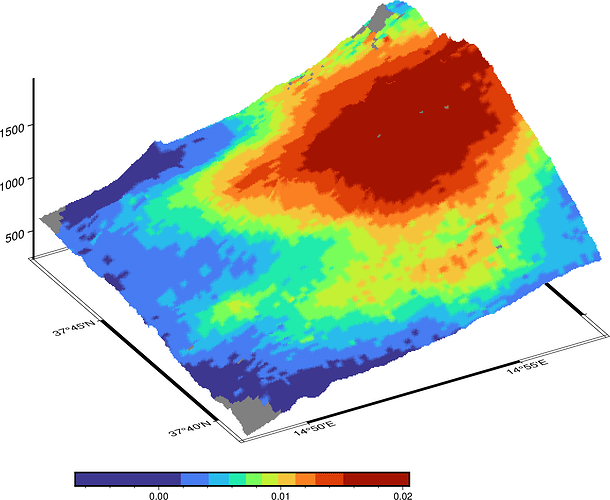
I’m trying to drape a grid (.tif) over a topographic grid to visualize it in 2D. However, I’m facing this issue:
→ if I use grdview I get this error message:
grdview [ERROR]: Using this data type (Float64) is not implemented
grdview (gmtapi_import_image): Bad measurement unit.  Choose among c|i|p [/data_wgs84.tif]
[Session pygmt-session (20)]: Error returned from GMT API: GMT_IMAGE_READ_ERROR (22)
[Session pygmt-session (20)]: Error returned from GMT API: GMT_IMAGE_READ_ERROR (22)
→ But if I use grdimage, it successfully generates the plot (using the same .tif file).
Since I can’t obtain any plot with grdview to compare with the obtain with grdimage, I’m wondering what could be the key difference between grdview and grdimage in this case. How could I fix the issue when plotting with grdview?
This is the way I’m trying to use grdview:
region=[lon_min, lon_max, lat_min, lat_max ]
grid_map = pygmt.datasets.load_earth_relief(resolution="01s", region=region)

data_file = "/data_wgs84.tif"

fig = pygmt.Figure()

pygmt.makecpt(cmap='jet', series=[-1.99, 1.99, 0.01])
shade1 = pygmt.grdgradient(grid=grid_map, azimuth="270", normalize="e0.6")
fig.grdimage(grid=grid_map,cmap="gray",shading=shade1)
fig.coast(water='lightblue')
pygmt.makecpt(cmap="gray", series=[0, 3500, 100])
#Draping data over topography
fig.grdview(
    projection="M15c",
    region=region,
    grid=grid_map,
    drapegrid=data_file,
    cmap="jet",
    transparency=25,
    surftype="s",
    frame="a0.2f0.1"
)

pygmt.makecpt(cmap='jet', series=[-1.99, 1.99, 0.01])
fig.colorbar(frame=["xa0.5+lEast", "y+lcm"])
Thanks for your help!


