Drawing a line in events

I’m making a movie that should simply draw a line (in plot you would simply use -W). But I’m having troubles with this. These are just pairs of x,y,time. Do I need to use trajectories?

Now I’m just plotting the points as small red filled circles, which gives the impression of a line. There must be a (simple) better way?

1 Like

Too late tonight but see events -A

When you say pairs of x,y,time you only have lines from A(t1) to B(t2), i.e., a series of not connected line segments? Or do you really have cruises or tracks like

x1, y1, t1
x2, y2, t2
x3, y3, t3

If you want to show the growth of that line of a section of it through time then, yes, you need to look at -A.

It’s a cruise track, so lat lon time. One long connected segment.

Here’s a minimal script creating the animation included.

# stuff to gmt events (ship track)
cat <<eof > long-lat-time.gmt
010:56.48643 78:06.99576 2009-05-09T204347.13
010:56.47279 78:06.99634 2009-05-09T204348.13
010:56.45915 78:06.99693 2009-05-09T204349.13
010:56.44551 78:06.99752 2009-05-09T204350.13
010:56.43190 78:06.99816 2009-05-09T204351.13
010:56.41830 78:06.99890 2009-05-09T204352.13
010:56.40475 78:06.99976 2009-05-09T204353.13
010:56.39106 78:07.00070 2009-05-09T204354.13
010:56.37716 78:07.00161 2009-05-09T204355.13
010:56.36329 78:07.00245 2009-05-09T204356.13
010:56.34951 78:07.00316 2009-05-09T204357.13
010:56.33591 78:07.00375 2009-05-09T204358.13
010:56.32262 78:07.00429 2009-05-09T204359.13
010:56.30921 78:07.00484 2009-05-09T204400.13
010:56.29570 78:07.00551 2009-05-09T204401.13
010:56.28198 78:07.00625 2009-05-09T204402.13
010:56.26794 78:07.00706 2009-05-09T204403.13
010:56.25375 78:07.00785 2009-05-09T204404.13
010:56.23947 78:07.00858 2009-05-09T204405.13
010:56.22549 78:07.00929 2009-05-09T204406.13
eof

# common
start=2009-05-09T20:43:47
stop=2009-05-09T20:44:06
gmt math -o0 -T${start}/${stop}/1s T = times.txt
plot='gmt plot -JM010:56.36329/78:07.00245/15c -R0.1/0.05+uk -Wthick long-lat-time.gmt'
events='gmt events -B0 long-lat-time.gmt -T${MOVIE_COL0}'

# make the 'bad' version with FORMAT_CLOCK_IN hhmmss.xx
cat<<eof > main.sh
gmt begin
gmt set FORMAT_CLOCK_IN hhmmss.xx
$plot
$events -Sc0.1c -Gred
$plot -Y8c
$events -Ar
gmt end
eof

time gmt movie main.sh -Ncruise-animation -C20cx20cx100 -Fgif+l -Ttimes.txt -V -Z -D12

rm times.txt main.sh long-lat-time.gmt

cruise-animation

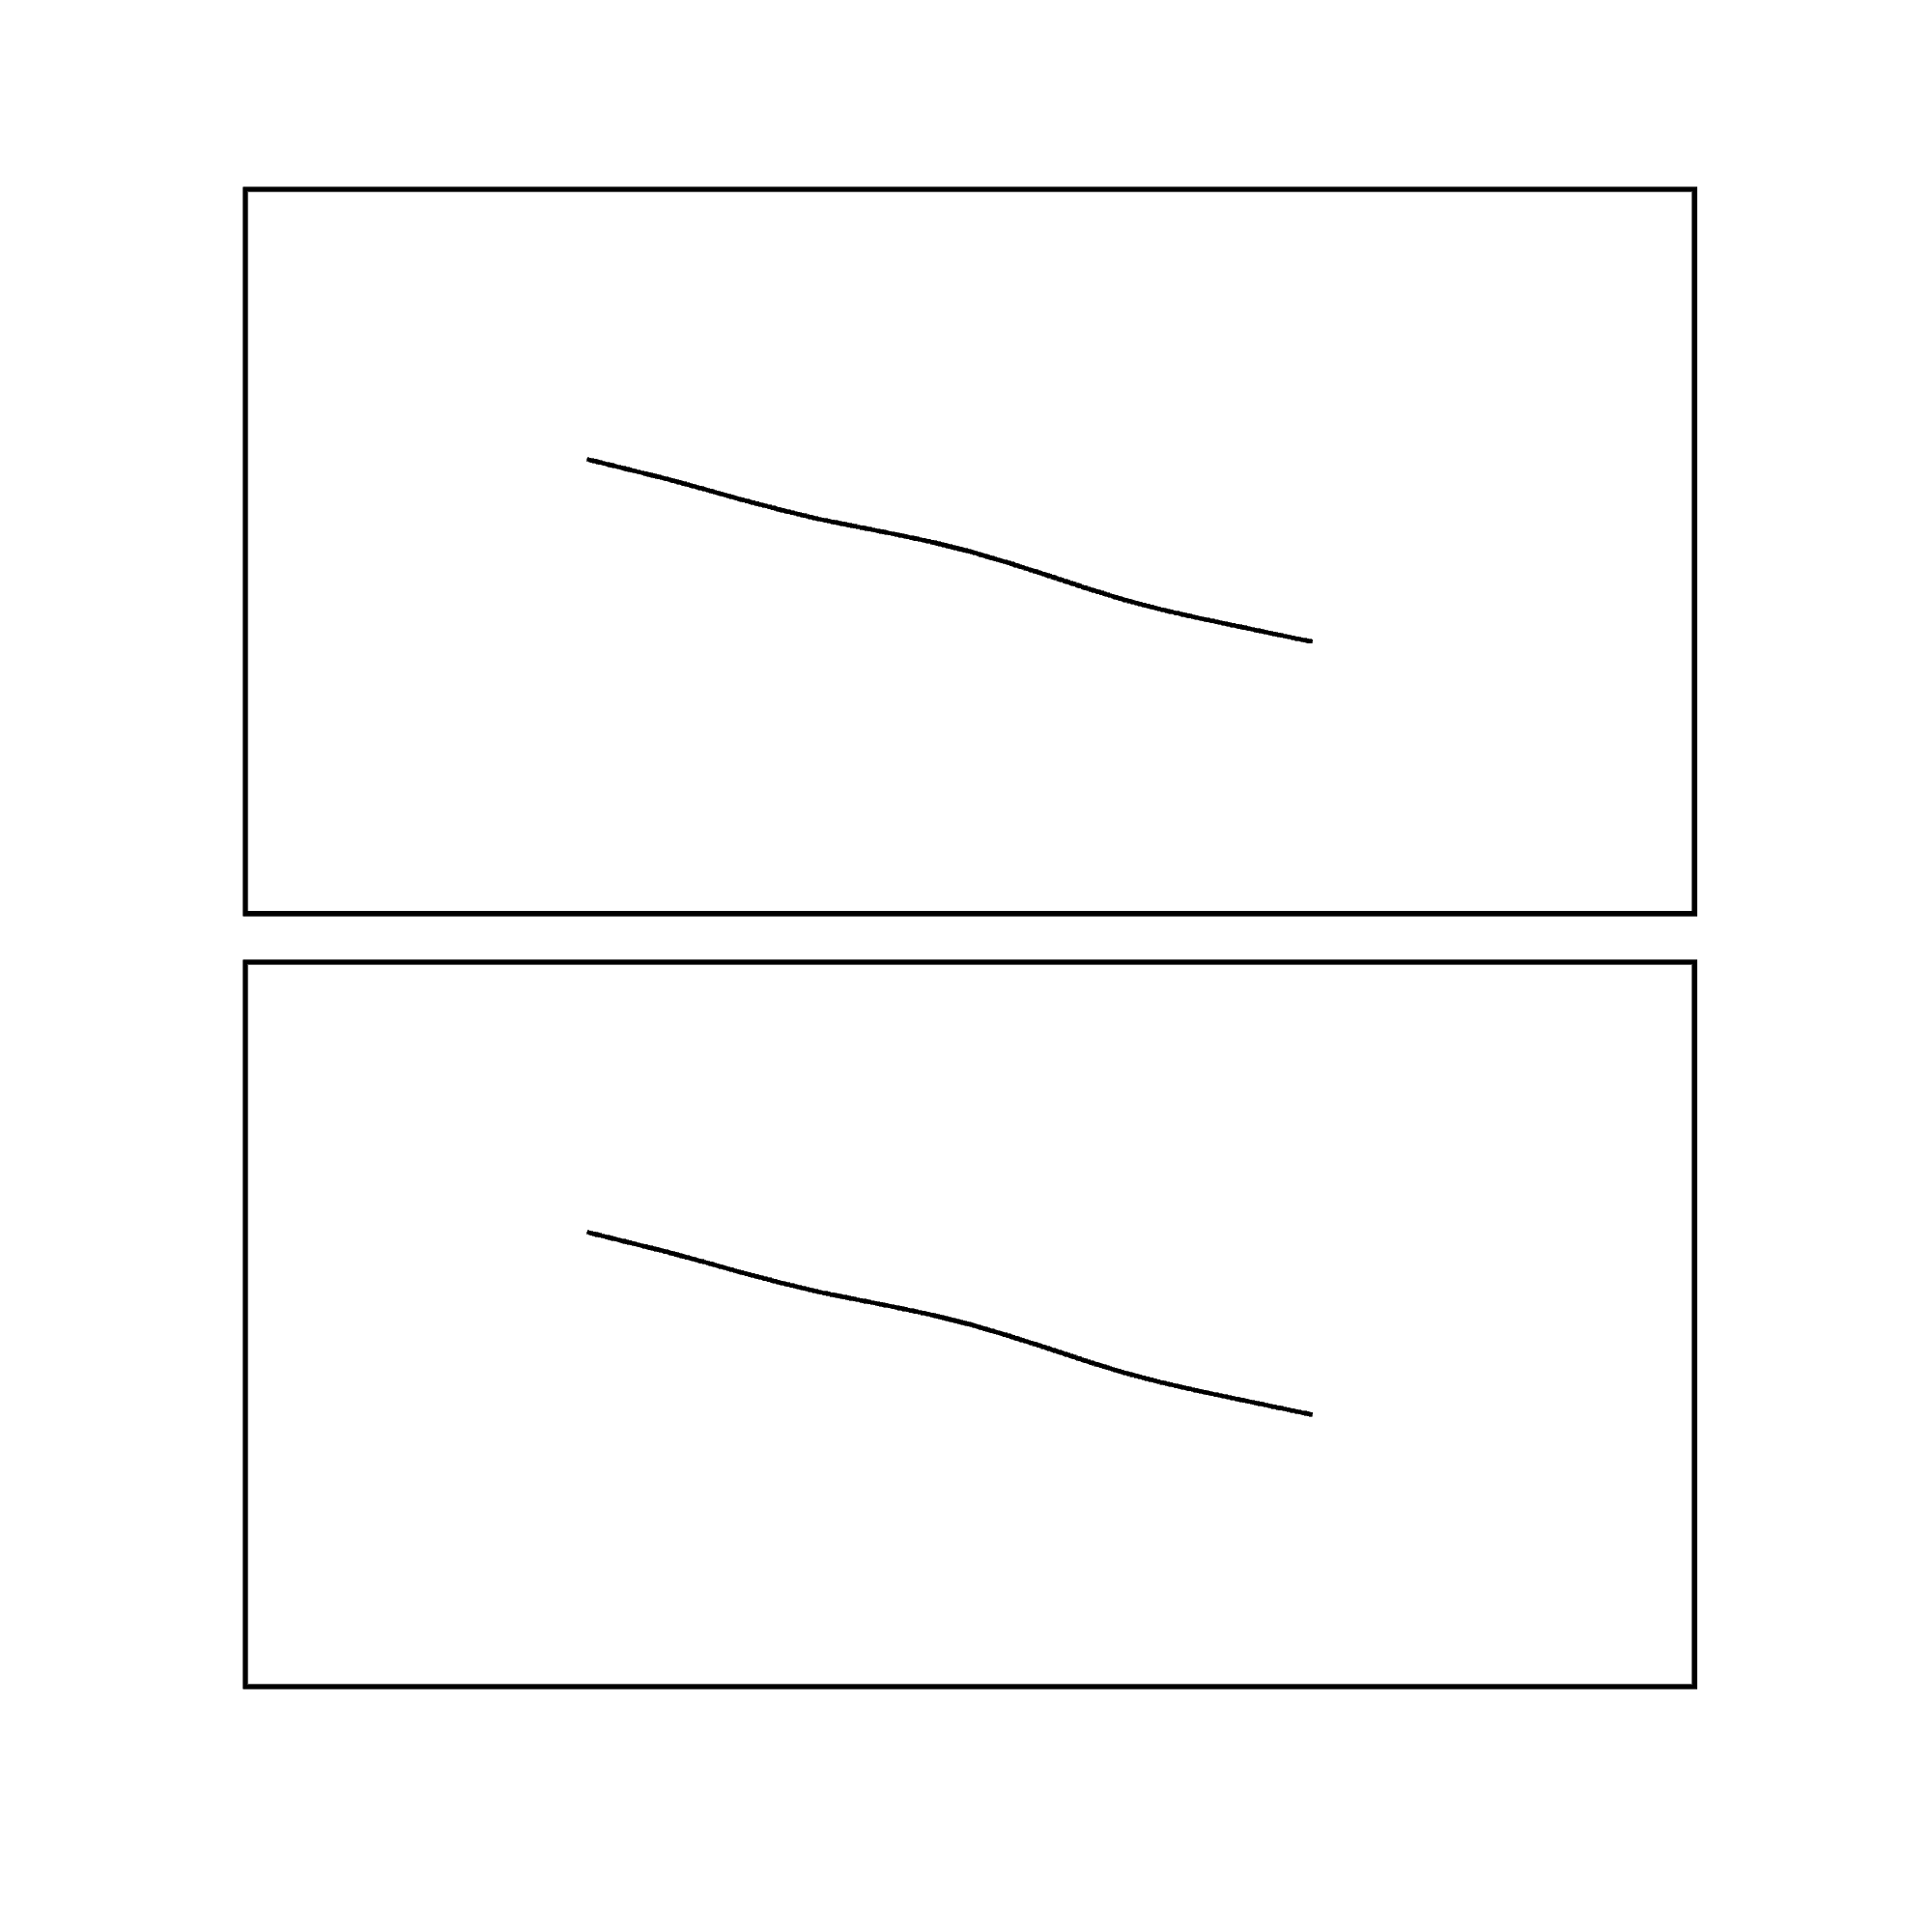
Instead of filled red circles (lower box in animation, which when used in my full script looks like a line), I would like to actually draw a line. I thought -Ar would be correct, but it’s doesn’t do anything (upper box in animation).

You need to run events -Ardpi in a pre script, once, and then use the result with events in the movie. See animation 13 for inspiration.

Thanks Paul.

-Ardpi makes a file with more densely populated points, which can be used to create a ‘line’; so ‘lines’ in events are actually (small color filled) circles(?).

Yes

1 Like

I think you already solve it. But, in anycase. I don’t know if you see this post. I thnk it could help you.

1 Like

Thank you @Esteban82, this is of great help!