Hi everyone,
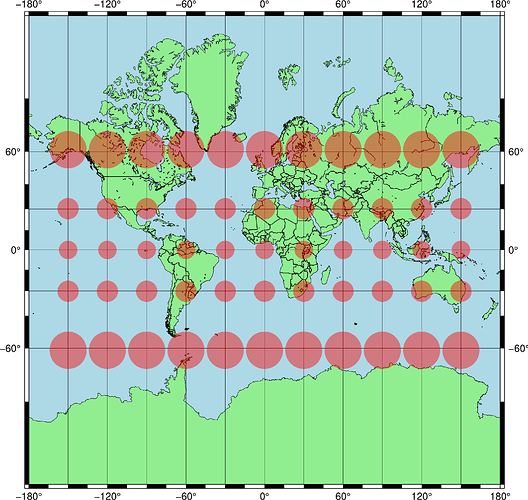
The Tissot’s indicatrix is a useful way to graphically display the distortion introduced by a map projection. For example, here is a Mercator projection map with Tissot’s indicatrices drawn on it:
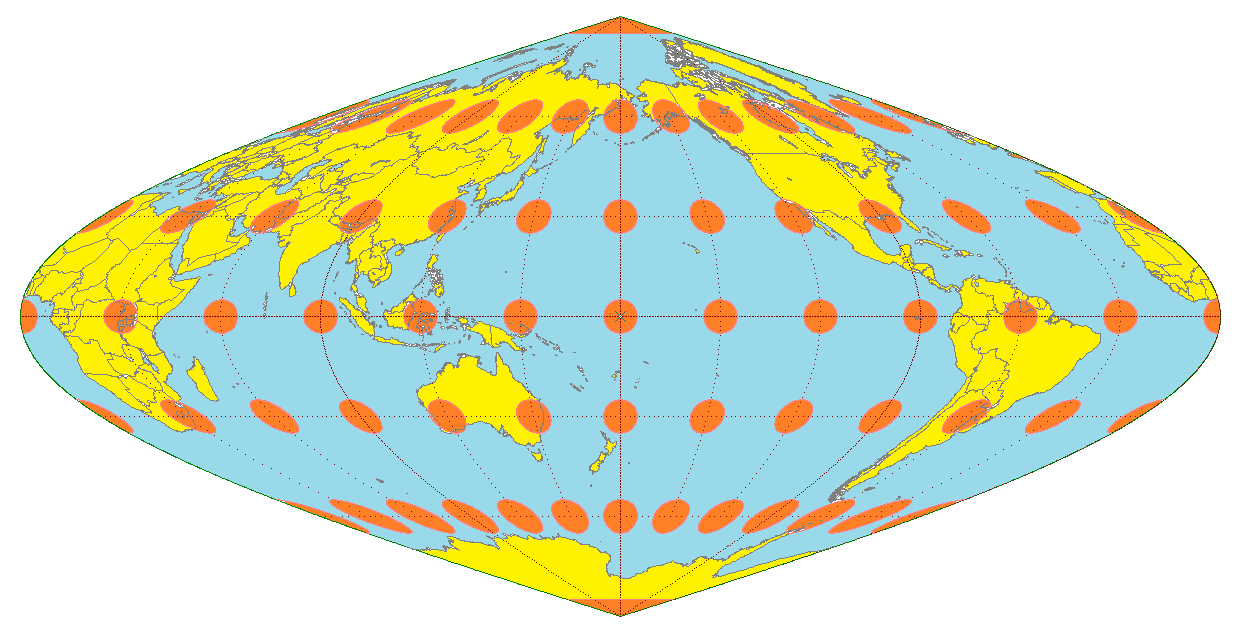
Here’s another example, for the sinusoidal projection:
In general, the Tissot’s indicatrix is ellipsoidal in shape.
Snyder provides a description of how to construct these indicatrices in his book “Map Projections - A Working Manual”, available here: https://pubs.usgs.gov/pp/1395/report.pdf
I was wondering if anyone has actually created a GMT script to draw these indicatrices? Looking at Snyder, I don’t think the task is trivial, so if someone has already worked out how to do it, it would be most helpful.
Cheers,
Tim Hume
Pretty sure you can just plot geographic circles and you will get your distortions. Here is a mock-up of your Mercator Tissot (although not sure what is going on with your Antarctica…). I’m picking 14 degree circles to try to match yours:
#!/bin/bash
gmt begin tissot png
  gmt grdmath -R150W/150E/60S/60N -I30 14 111.113 MUL = t.nc
  gmt coast -R-180/180/-85/85 -JM20c -Glightgreen -Slightblue -Bafg30 -N1/0.5p -W0.25p -Dl -A500
  gmt grd2xyz t.nc | gmt plot -SE- -Gred@75
gmt end show
I don’t think this is the solution - but it’s close. The indicatrices are meant to be ellipses, no matter what the projection. I have a suspicion that if one worked out the shape of a very small circle (say 10 m radius) in the map projection, and then magnified it, this would be closer.
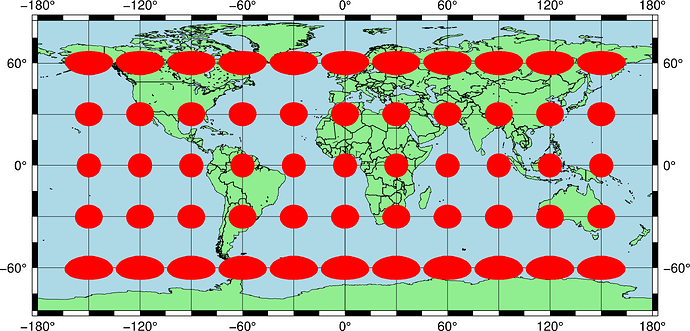
Here’s what the 14 degree radius circles look like in the Cylindrical Equidistant projection:
The shapes on the 60 degree north and south meridians aren’t ellipses. I started putting together a very hacky script using mapproject and awk to try and get ellipses. It’s not working yet.
In the meantime, maybe your solution could be called Wessel’s indicatrix 
Edit: subsequent Google searches show examples of Tissot’s indicatrices which look like the squashed ellipses in the cylindrical equidistant plot above. But the mathematical description says they should be true ellipses. This thing is irking me enough that I’m going to work out a solution and post it here 
OK, but for a conformal projection I think a circle remains a circle, otherwise not conformal, no?
But agree that it should be evaluated at a small radius, then plotted with a larger scale.
Yes, I think so.
Bit of background. I’m hacking together a script to plot the “Euler spiral map projection” - it’s the projection one gets by “peeling” an orange and flattening the resulting peel. I want to plot Tissot’s indicatrices on this map projection. It’s for an article I’m thinking of writing as maths extension for high school students.
See: https://arxiv.org/abs/1202.3033 for the maths.
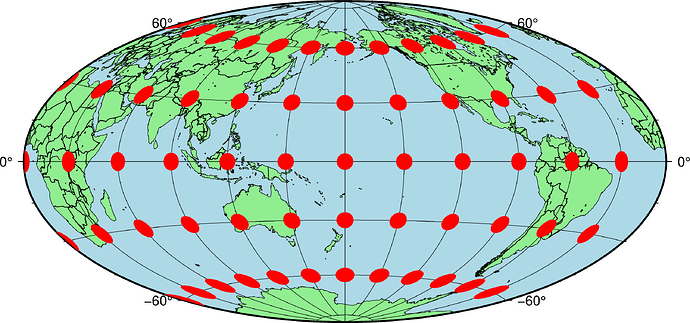
Here’s my ultra hacky script to plot Tissot’s indicatrices on a global map. Set the map projection on line 3; it’s currently set to the Hammer projection. I wouldn’t guarantee it’s correct, but it looks reasonable at a first glance.
#!/usr/bin/env bash

mapproj=h               # Hammer projection - modify as required.
scale="1:200000000"

#
# First compute the cartesian co-ordinates for a 10 m radius circle.
#
awk 'BEGIN{
  printf("0\t0\n"); # Centre point
  for (ang=0; ang<=6.283185307; ang+=0.01256637061){
    x=10*cos(ang);
    y=10*sin(ang);
    printf("%10.8f\t%10.8f\n", x, y);
  }
}' > circle.xy

 #
# Start by drawing the coastline in the desired map projection.
#
gmt begin tissot png
gmt coast -Rg -J${mapproj}${scale} -Glightgreen -Slightblue -Bafg30 -N1/0.5p -W0.25p -Dl -A500
  #
  # At each geographical location where a Tissot indicatrix is wanted, work out the
  # latitudes and longitudes of the 10 m circle centred at this point. Then work out
  # how these latitudes and longitudes project to cartesian coordinates in the
  # map projection of interest.
  #
  for lon in 0 30 60 90 120 150 180 210 240 270 300 330
  do
    for lat in -60 -30 0 30 60
    do
      gmt mapproject -Js"${lon}"/"${lat}"/1:1 -Rg -I -C -F < circle.xy > circle.ll

      #
      # Project the small circle into the desired map projection. Work out what the projected
      # coordinates are relative to the centre of the circle (the awk part).
      #
      gmt mapproject -J${mapproj}1:1 -Rg -F < circle.ll | awk '
      (NR == 1){
        cx=$1;
        cy=$2;
        next;
      }
      {
        printf("%10.8f\t%10.8f\n", $1-cx, $2-cy);

      }' > tissot.xy

      #
      # Now overlay the indicatrix on the map.
      #
      echo "${lon} ${lat}" | gmt mapproject -Rg -J${mapproj}${scale} | cat - tissot.xy | awk '
      (NR == 1){
        cx = $1;
        cy = $2;
        next;
      }
      {
        printf("%f\t%f\n", cx+$1/40, cy+$2/40);
      }' | gmt mapproject -Rg -J${mapproj}${scale} -I | gmt plot -J${mapproj}${scale} \
        -Rg -Wthinnest,red@75 -Gred@75

    done
  done
gmt end show
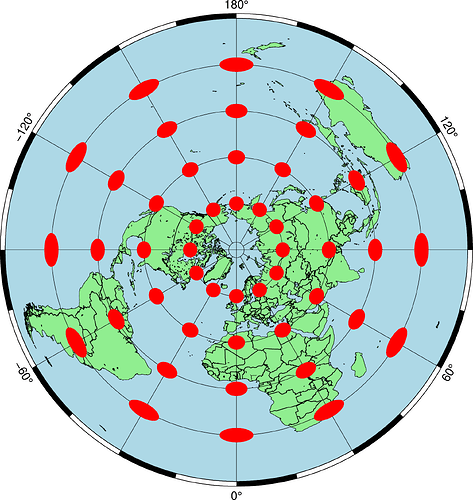
Using slightly modified code, here’s the indicatrices for the UN logo map projection:
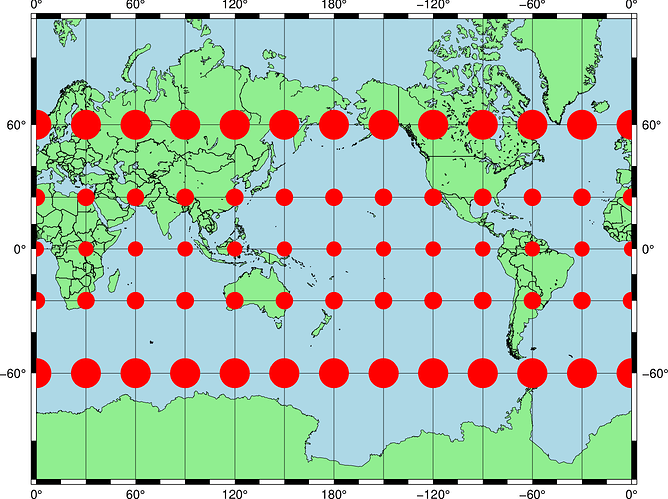
And good old Mercator:

