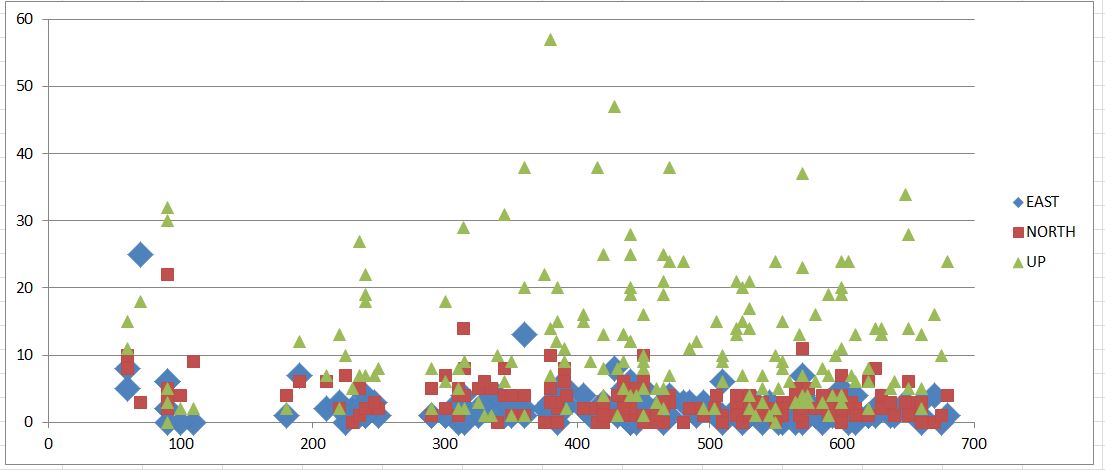
Hello friends, I want to create the attached graphic on gmt. For this
gmt begin difference
gmt set FONT_HEADING 12p
gmt subplot begin 2x1 -Fs15c/5c -Bxaf -Byaf -BWSne+gazure
gmt subplot set 0
gmt plot -Bxa -Bya1g+l “Difference (mm)” -BWStr+gazure1 -JX15c/5c -R0/700/0/60
gmt plot MFE.txt -Sc0.08 -Gblue -l “East”
gmt plot MFN.txt -Ss0.08 -Gred -l “North”
gmt plot MFU.txt -St0.08 -Gdarkgreen -l “Up”
          gmt subplot begin 2x1 -Fs15c/5c -Bxaf -Byaf -BWSne+gazure
          gmt subplot set 1
          gmt plot -Bxa -Bya1g+l "Session Duration" -BWStr+gazure1 -JX15c/5c -R0/700/0/60
          gmt plot MFE.txt -Sc0.08 -Gblue -l "East"
          gmt plot MFN.txt -Ss0.08 -Gred -l "North"
          gmt plot MFU.txt -St0.08 -Gdarkgreen -l "Up"
I wrote the codes but I couldn’t create the graphic. Can you help me with this?
Hello @ihsan_kaya,
please see the documentation (subplot — GMT 6.5.0 documentation) and and a general example (subplot — GMT 6.5.0 documentation) on how to set up a subplot. Some comments on your code:
- The end directives for both
gmt begin and gmt subplot begin are missing.
- Potentially there are some confusions of
plot and basemap.
- White spaces between flags / modifiers and the agrument are not allowed.
For the code example below I used some random data:
gmt begin difference png

    gmt subplot begin 2x1 -Fs15c/5c -JX15c/5c -R-5/5/-5/5 -Bxa -Bya1g

        gmt subplot set
        gmt basemap -Bx+l"Difference mm"
        echo -2 0 | gmt plot -Sc0.5c -Gblue -lEast
        echo  0 0 | gmt plot -Ss0.5c -Gred -lNorth
        echo  2 0 | gmt plot -St0.5c -Gdarkgreen -lUp

        gmt subplot set
        gmt basemap -Bx+l"Session Duration"
        echo -2 0 | gmt plot -Sc0.5c -Gblue -lEast
        echo  0 0 | gmt plot -Ss0.5c -Gred -lNorth
        echo  2 0 | gmt plot -St0.5c -Gdarkgreen -lUp

    gmt subplot end

gmt end show