wbm06
March 3, 2021, 6:11pm
1
Hey,
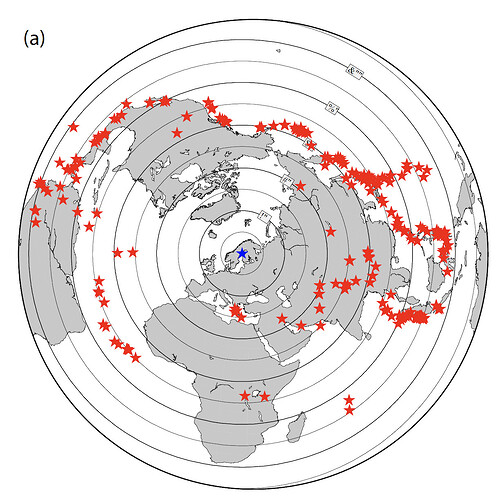
for the moment I only get strange plot like this figure
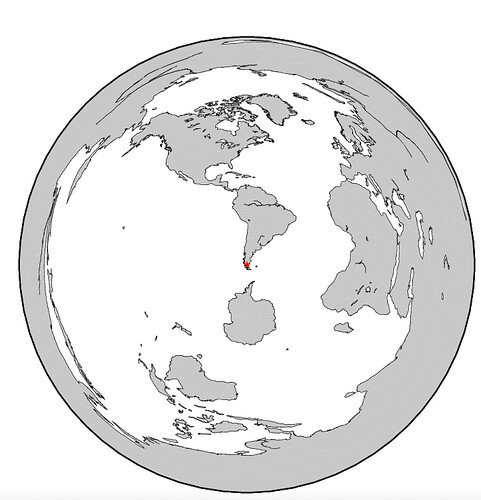
when I want to do similar plot. Not sure what is it wrong here and why I cannot get epicentral line every 20 degree. I didn’t include EQ. Any comment or advice.
lon=-71
Cheers
Walid
I use:
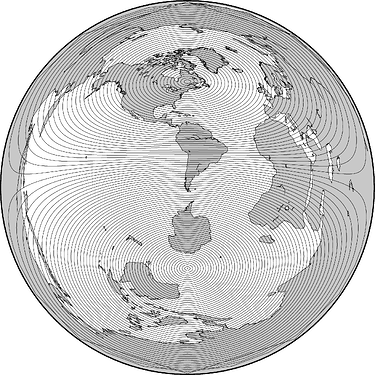
gmt grdmath -Rd -I1 $lon $lat SDIST = dist.grd and change
and change -C20 to -C200 (this are distance in km, 20 is too low) and I get
and I get
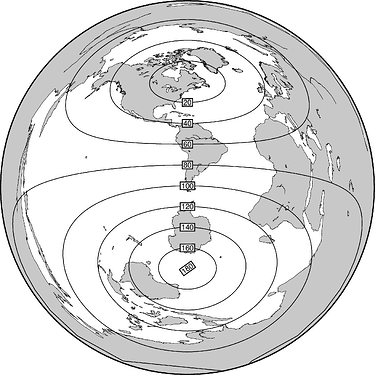
PS: If you would like degrees I think you could try grdmath KM2DEG (Converts Kilometers to Spherical Degrees).
Full script:
lon=-71
lat=51
gmt psbasemap -R -JE-71/-51/18.0 -B20 -P -K > event_map.ps
gmt pscoast -R -J -Dl -B -V -S255 -G200 -W -A5000/1/4 -O -K >> event_map.ps
gmt psxy -R -J -Sa0.3 -Gred center -K -O >> event_map.ps
gmt grdcontour -J dist.grd -A20+s10+p1+g240 -Glz-/z+ -C200 -O >> event_map.ps
1 Like
Yes, KM2DEG works:
lon=-71
lat=51
gmt grdmath -Rd -I1 $lon $lat SDIST KM2DEG = dist.grd
gmt psbasemap -R -JE-71/-51/18.0 -B20 -P -K > event_map.ps
gmt pscoast -R -J -Dl -B -S255 -G200 -W -A5000/1/4 -O -K >> event_map.ps
gmt grdcontour -J dist.grd -A20+s10+p1+g240 -Glz-/z+ -C20 -O >> event_map.ps
1 Like


