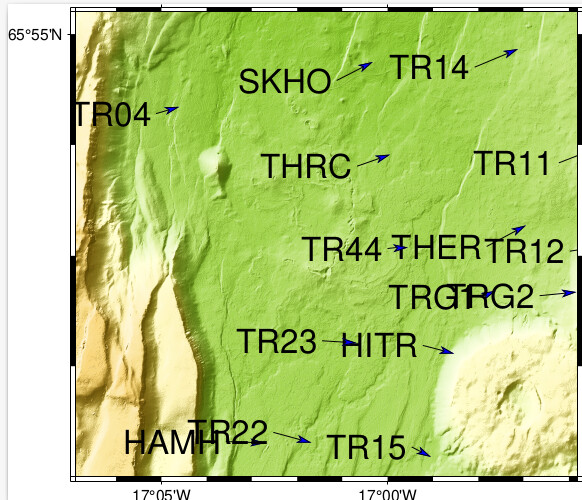
Hi All,
I’m a relative new user of pyGMT, love the software! I had two questions related to the figure.velo function for use in GPS plotting. The first is how do you resize the station name sizes? According to the documentation for pygmt and gmt, this looks like it should be done in the resize (+f) option. I have messed around with this but it seems to not be having any affect, it looks like the standard 9pt helvetica text (see screenshot below).
The question is has anyone had any experience producing GPS legends with velo? Creating a fig.legend() prompt with velo causes the terminal session to crash, so I cant think of an easy wat to create a legend to reference vector sides (say 1cm vector = 1mm/yr displacement). Here is the code im using for fig.velo, the other portions of my map seem to be working correctly:
‘’’
fig.velo(
region[minlon, maxlon, minlat, maxlat],
line = True,
rescale = “+f2p,Helvetica-Bold”,
pen = “0.03p”,
spec = “e0.2/0.39/19”
projection = “M4i”
vector = “0.3c+p1p+e+gblue”
)
‘’’
Thank you in advance!
Regards,
Kyle
