I have never needed this but if it is becoming important to many the it wouldn’t take me long to implement
All I can tell is that it’s common in climatology. Don’t know much for other fields 
[edit : I opened a feature request on github, just in case]
Note that the solution has to be like explained in that Matlab post otherwise, for low density lines this effect will become striking
Needless to say that my GMT.jl solution is ofc a GMT one too.
1 Like
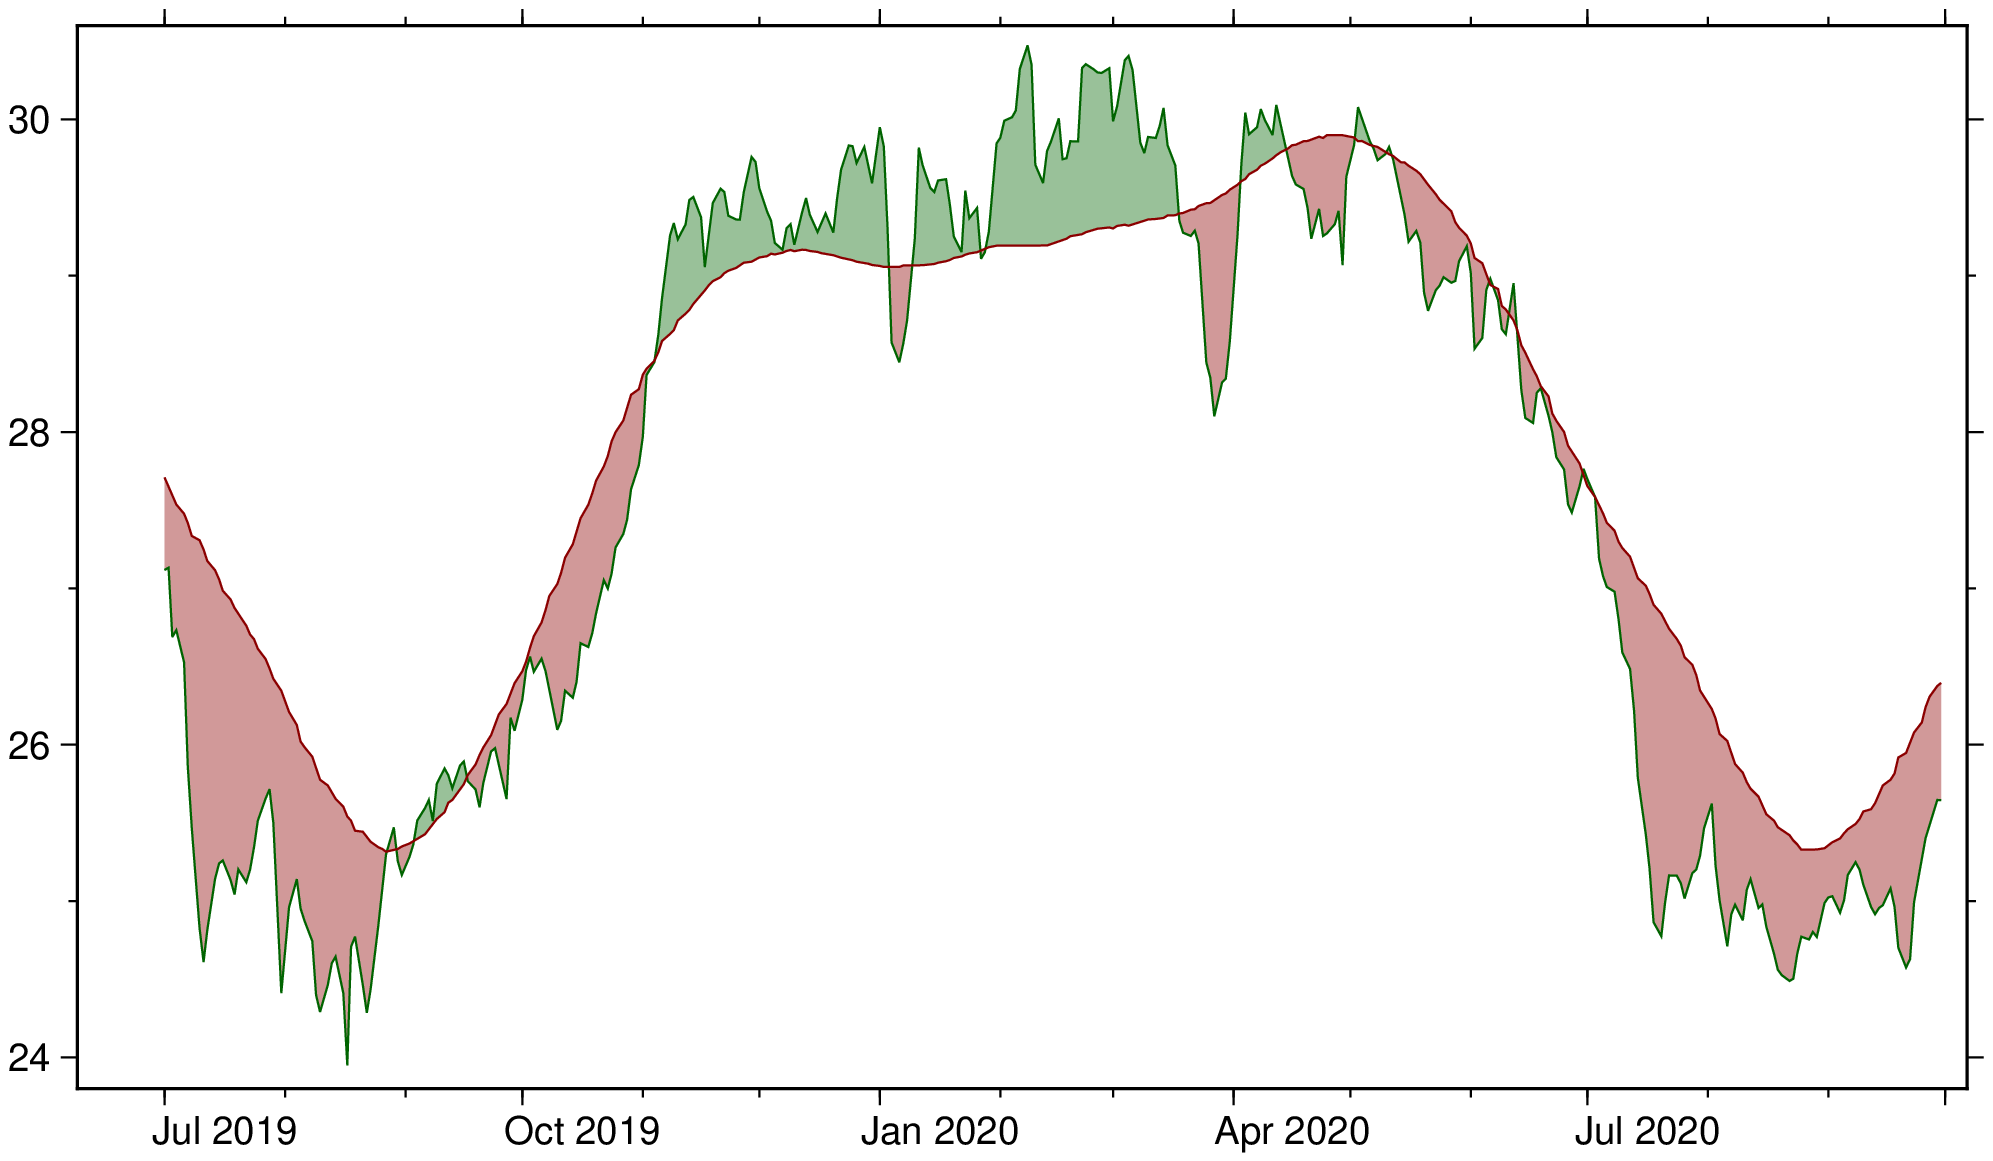
julia> t = gmtread("time.txt");
julia> a = gmtread("A.txt");
julia> b = gmtread("b.txt");
julia> D = mat2ds([t a b]);
julia> D.attrib["Timecol"] = "1";         # Inform that first column has Time
julia> fill_between(D, figsize=(16,9),  show=true)
Well done! @PlanetGus for opening a feature request.
Is there a way to add a legend in GMT.jl? “a>b”, “a<b”, a, b?
https://www.generic-mapping-tools.org/GMTjl_doc/documentation/modules/fill_between/
Labeling a, b is trivial, just add legend=a,b. From figure immediately follows where a>b & vice-versa. But if a complex legend is wished, just add one with the legend module
Those interested in this topic can check out the draft branch here.
1 Like