Hello all.
I’d like to fill the intersection between two curves exactly as it is done in Julia GMT using the “Filled curves” function @Joaquim . I’m using GMT on MacOS.
I can’t figured out what I’m doing wrong in my script.
Please find attached my script and proxy data.
Any help will be greatly appreciated!
That doesn’t work. Read this post to see what has to be done
Isn’t it muuuuuch easier to simply use GMT.jl?
Thanks @PlanetGus.
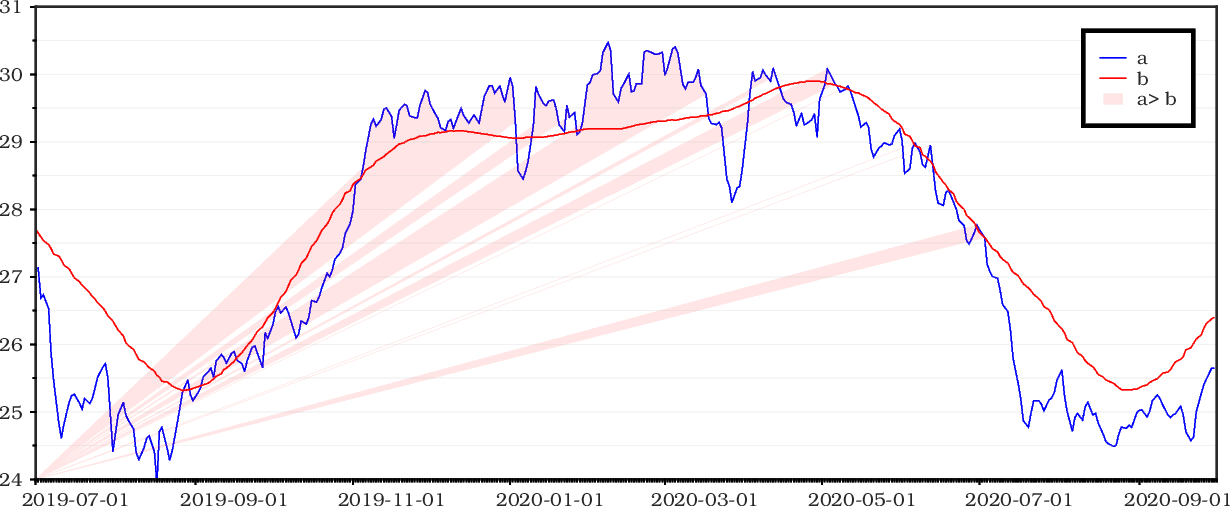
Look exactly as I’ve tried to do but can’t figure out why they all stretched from the origin of the scale.
Any ideas?
NaNs?
Instead of NaNs, what do you recommend?
No I mean, don’t you have NaNs that mess up the shading? It seems like you’re only plotting a polygon from origin to wherever blue curve is above red one. What’s your script?
I have NaN in the new outputs. Here attach.
reason why, I’m asking what should used instead of NaN, seems to be the one messing the data.
a_b.txt (2.6 KB)
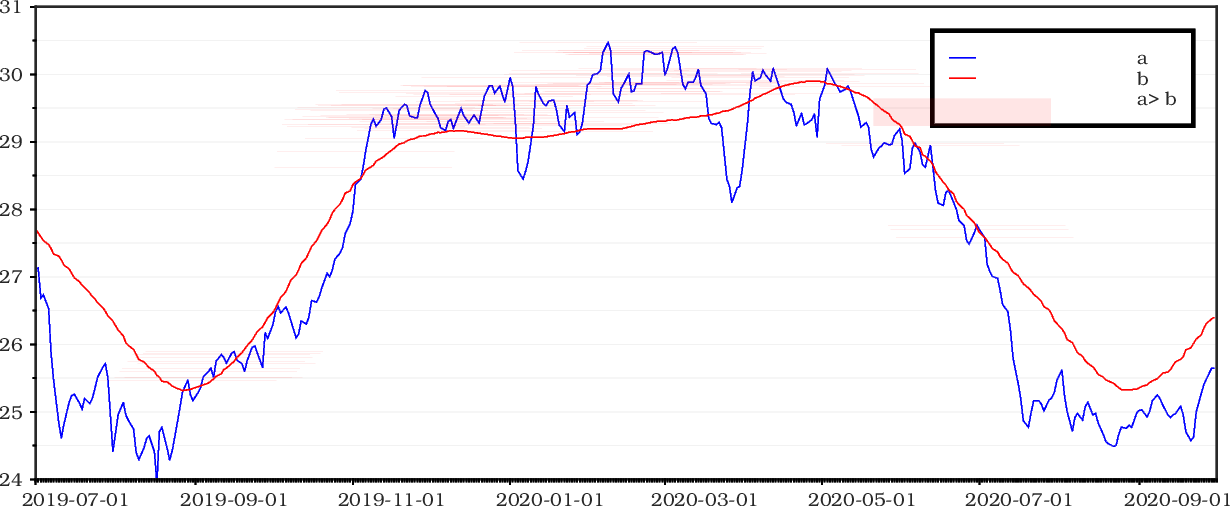
Oops, just seen it.
It seems like you’re not using -Sb right?
You, on the other hand, are plotting three points that GMT converts to closed polygon
Yes, because even with Sb, i don’t know how to evaluate the metric value to use. -Sb**?**q+b!
it’s your data resolution.
If you use greater value, the rectangles will overlap, if smaller, you’ll see a blank space between them.
In this case, you have daily data so… -Sb1 I guess
my script is text3.txt
Does it work now?
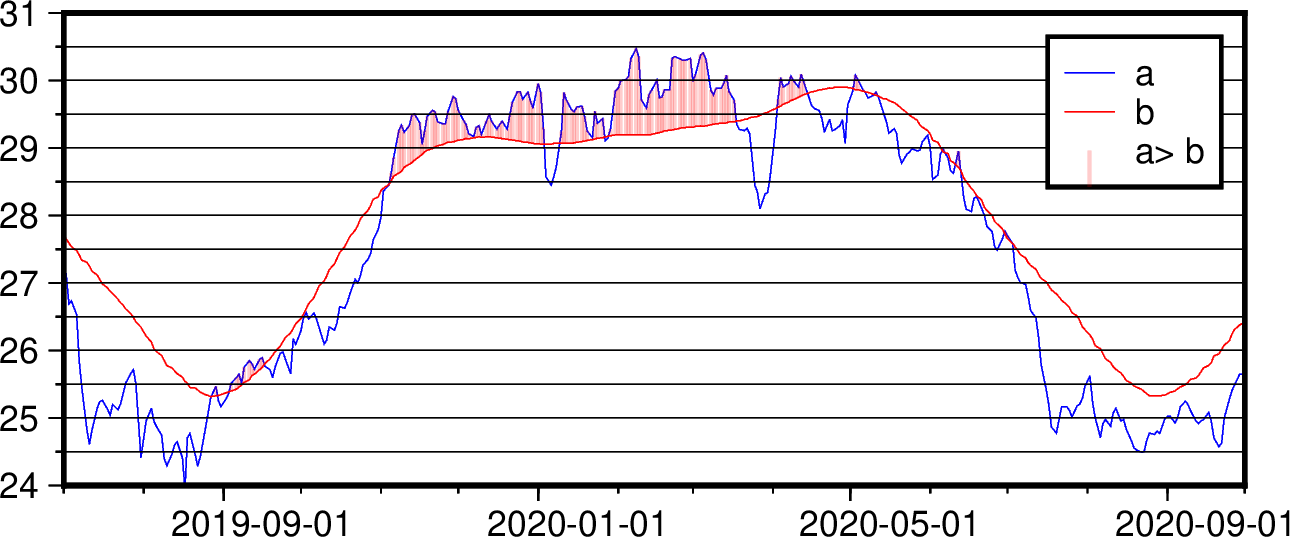
As you figured it out, I’m using daily dataset and while even using Sb1 rectangle are overlapping.
Here’s the new graph and upgraded script.
test3_script.txt (483 Bytes)
Can you add --TIME_UNIT=d to the shade plot command?
It looks like « 1.5 » is interpreted as 1.5 months (even more actually but I assume the plot and the script are not the same version).
Also, bxa2Of1d is a little crowded IMO  maybe f7d?
Still the same… nothing has changed! 
Well, the issue is most likely time unit related so
-Sb[…] --TIME_UNIT
-Sb1d+b (not sure it works)
-Sb0.032+b
Thank @PlanetGus for your contribution. I’ve to definitely found a proper way to make it work. As mentioned, the issue should be on -Sb…
I just looked at your data, the problem is that your timeline is non-linear (or has gaps).
To have a nice filling (-Sb?q+b), the points need to be evenly spaced (so you need to interpolate), or the width of the bars need to be adjusted to match the gaps (using gmt math -Q time.txt DIFF = for example).
Or you can be satisfied with small blank spaces, then your width could simply be 10/349 (plot width / number of lines) :
maybe offtopic here, but gnuplot does this easily using with filledcurves:
#!/usr/bin/gnuplot

set term pngcairo
set output "time.png"
set xdata time
set format x "%b\n%Y"
set grid
set key top right
set timefmt "%Y-%m-%d"
plot "< paste time.txt a.txt b.txt" \
        using 1:2:3 with filledcurves above linecolor rgb "light-blue" fill transparent solid 0.5 noborder title "a>b", \
     "" using 1:2:3 with filledcurves below linecolor rgb "light-red" fill transparent solid 0.5 noborder title "a<b", \
     "" using 1:2 with lines linetype -1 linecolor rgb "blue" title "a", \
     "" using 1:3 with lines linetype -1 linecolor rgb "red" title "b"
the result:
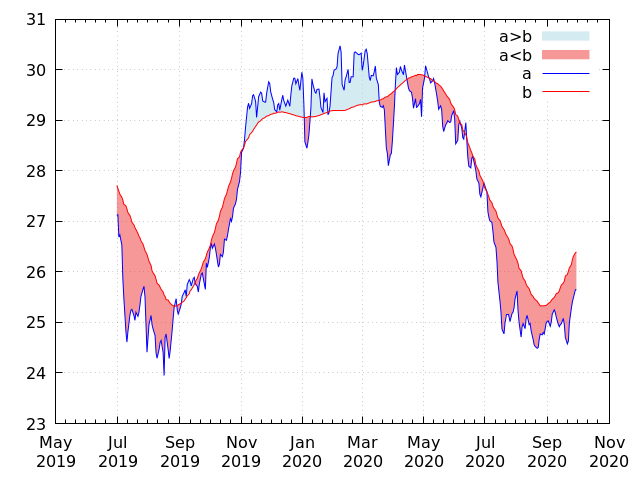
https://gnuplot.sourceforge.net/demo_5.4/fillbetween.html
EDITS: setting line colors as in the gmt plots above
1 Like