Hi all,
I am currently trying to run the example files from the FMTOMO documentation. Since the doc examples run on an old GMT version, I had to come up with new bash plotting scripts compatible with the latest GMT version’s syntax (v6.4.0).
Below I have pasted my plotting script for an EW section through a layered velocity model created by jointly inverting for synthetic reflection, refraction, and teleseismic arrival time residuals to solve for the 3-D velocity and interface structure:
#!/usr/bin/env bash

psfile="gmtslice.ps"

gmt begin $psfile

gmt set FONT_ANNOT_PRIMARY Helvetica,16p

# Plot velocity field
gmt xyz2grd grid2dvew.z -Ggrid2dvew.grd -R138/142/-101.000000000003/1.49999999999700 -I461+/481+ -ZTL
gmt grdimage grid2dvew.grd -JX8.0i/2.6i -Cvelrelativesc.cpt -Bxa0.5f0.25 -Bya20f10

# Plot scale bar
gmt psscale -Ba0.3f0.1 -Cvelrelativesc.cpt

# Plot moho interface
gmt psxy intew.xy -R138/142/-101.000000000003/1.49999999999700 -JX8.0i/2.6i -W7/0/0/0

# Plot sources, receivers, and ray paths
# Ray Paths: gmt psxy raysew.xy
gmt psxy sourcesew.xy -R138/142/-101.000000000003/1.49999999999700 -JX8.0i/2.6i -Sa0.40 -Gred -W2/0/0/0
gmt psxy receiversew.xy -R138/142/-101.000000000003/1.49999999999700 -JX8.0i/2.6i -Si0.40 -Gblue -W2/0/0/0

# Display output
gmt end show
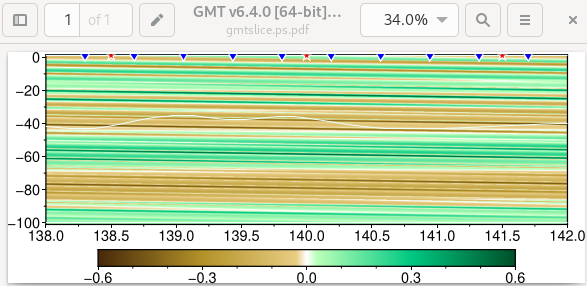
This is what my output plot looks like:
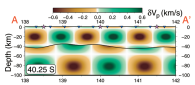
What it’s supposed to look like:
I am new to coding, nevermind making use of bash and fmtomo within linux. What I tried to accomplish here was to alter the already-made example script to fit the latest GMT syntax.
Everything plots correctly, except the velocity field, IMHO, meaning the problem likely lies between either the xyz2grd or grdimage modules.
This is what I’ve tried so far to fix the velocity field:
Tried using the two different supplied colour maps - velrelativesc.cpt and velrelative.cpt
Checked that my values in my grid2dvew.z file looks correct.
Made sure my -R and -I values correspond to the boundew.gmt file values.
Tried different interpolation methods for xyz2grd.
Any help would be greatly appreciated.
Kind regards,
Liam