Is it possible to add a legend of the beachball/focal mechanism for Pygmt and GMT? I mean the legend contains 1 for strike-slip, 1 normal, and 1 for reverse.
Hello @dorotdot,
Apologizes for the late response!
Your question seems partly similar to this post: Add focal mecanism in legend - Q&A - GMT Community Forum (generic-mapping-tools.org).
In general you can add a legend to your plot using pslegend / legend (please see pslegend — GMT 6.4.0 documentation (generic-mapping-tools.org) / legend — GMT 6.4.0 documentation (generic-mapping-tools.org)) or pygmt.Figure.legend (please see pygmt.Figure.legend — PyGMT).
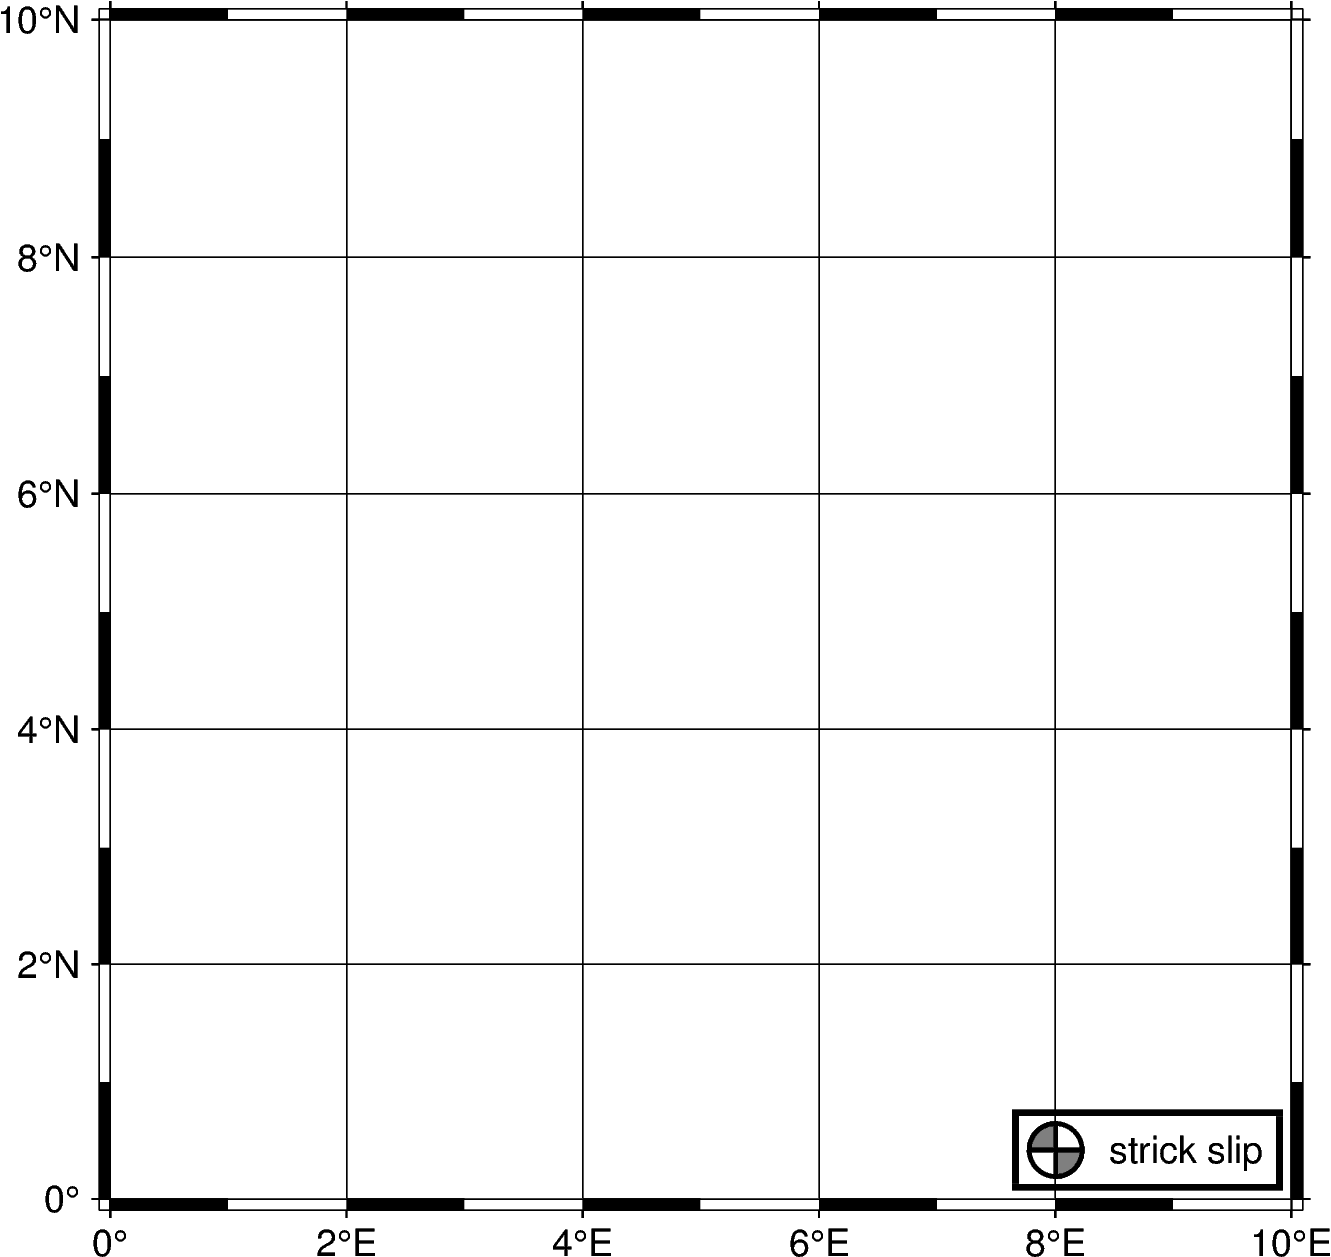
The self -defined symbol (k) meca draws a strike-slip focal mechanism for usage in a legend.
Please see below a PyGMT code example. You need to place the legend file
gmt_legend_meca.txt (95 Bytes) in your working directory.
import pygmt

fig = pygmt.Figure()

fig.basemap(
    region=[0, 10, 0, 10],
    projection="M10c",
    frame="afg",
)

fig.legend(
    spec="gmt_legend_meca.txt",
    position="JRB+jRB+o0.1c/0.1c",
    box=True,
)

fig.show()
# fig.savefig(fname="legend_meca_custom.png")
output figure:
However, I do not know about “official” self-defined symbols for normal and reverse faults. You can try to define own self-defined symbols (see 18. Custom Plot Symbols — GMT 6.4.0 documentation (generic-mapping-tools.org)).
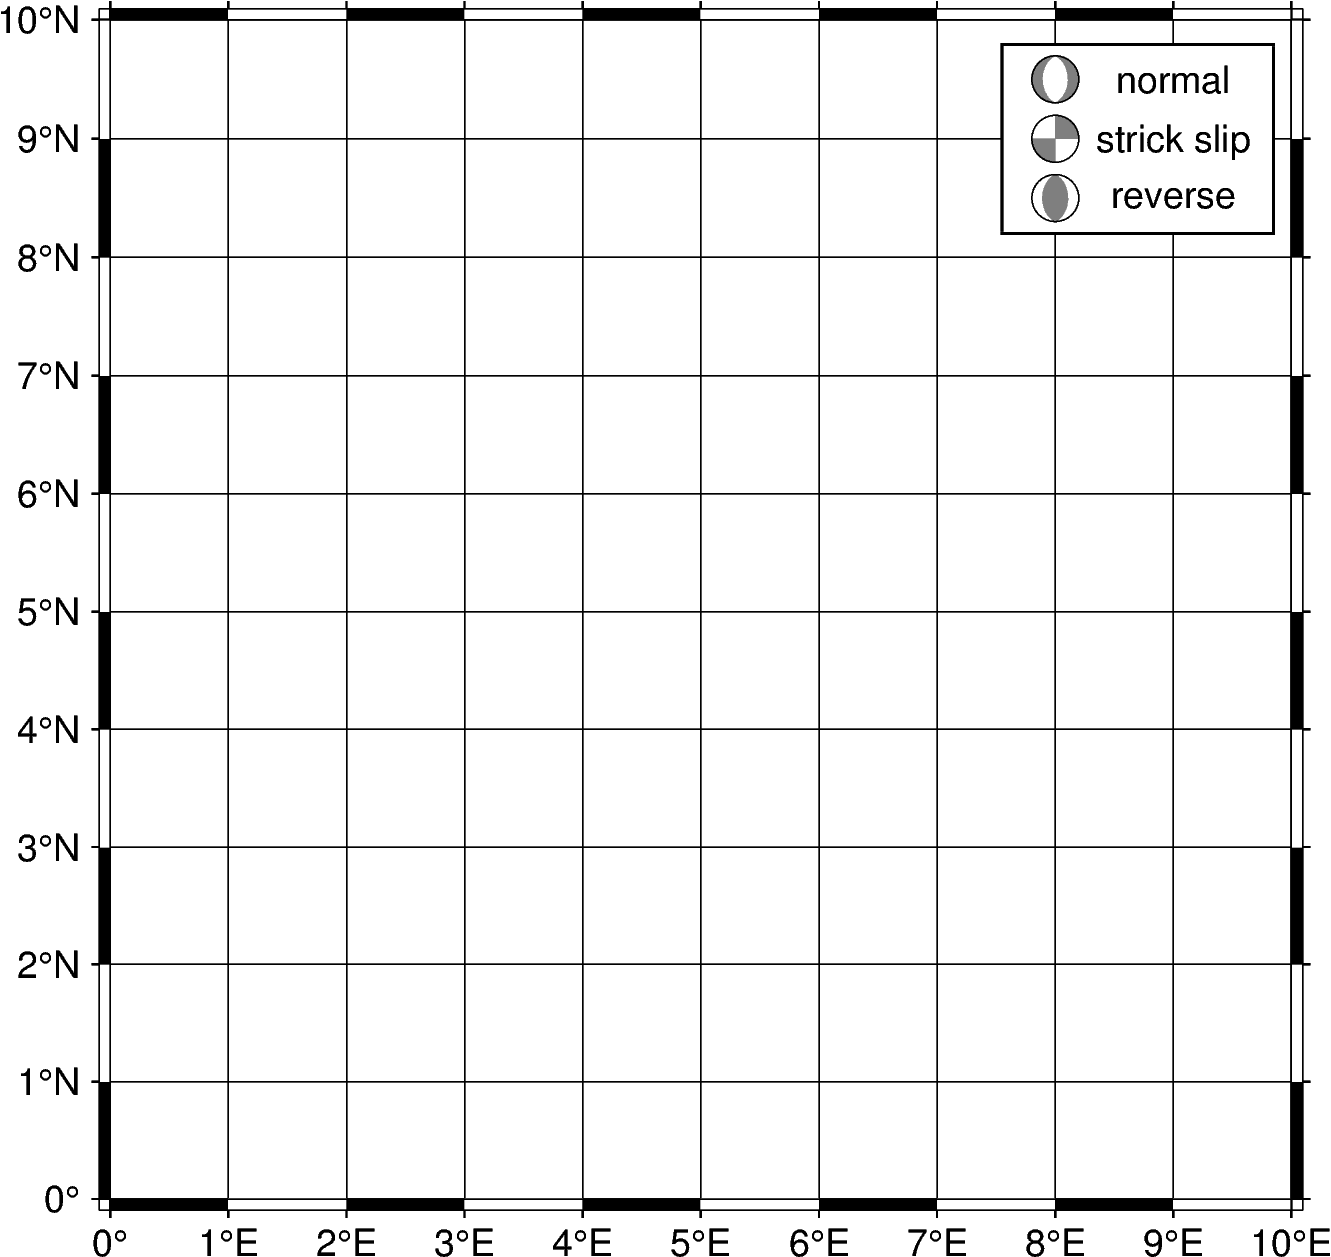
Another (laborious) way is to create a legend manually.
Please see below a code PyGMT code as orientation (for a map with a Mercator projection):
import pygmt

color_meca = "gray50"
scale_meca = "0.4c"
convention_meca = "aki"

# set up dictonaries
dict_meca_normal = {
    "longitude": 8.0,
    "latitude": 9.5,
    "depth": 10,
    "strike": 180,
    "dip": 45,
    "rake": -90,
    "magnitude": 5,
}
dict_meca_strike_slip = {
    "longitude": 8.0,
    "latitude": 9.0,
    "depth": 10,
    "strike": -90,
    "dip": 90,
    "rake": 180,
    "magnitude": 5,
}
dict_meca_reverse = {
    "longitude": 8.0,
    "latitude": 8.5,
    "depth": 10,
    "strike": 180,
    "dip": 45,
    "rake": 90,
    "magnitude": 5,
}

# create figure object
fig = pygmt.Figure()

# make basic map
fig.basemap(
    region=[0, 10, 0, 10],
    projection="M10c",
    frame="a1fg1",
)

# make box
fig.plot(
    x=8.7,
    y=9.0,
    style="r2.3c/1.6c",  # rectangle
    color="white",  # fill color
    pen="0.6p,black",  # outline thickness and color
)
# plot beachballs
fig.meca(
    spec=dict_meca_strike_slip,
    G=color_meca,  # fill color
    convention=convention_meca,
    scale=scale_meca,
)
fig.meca(
    spec=dict_meca_normal,
    G=color_meca,
    convention=convention_meca,
    scale=scale_meca,
)
fig.meca(
    spec=dict_meca_reverse,
    G=color_meca,
    convention=convention_meca,
    scale=scale_meca,
)
# add annotations
fig.text(
    text="normal",
    x=9.0,
    y=9.5,
)
fig.text(
    text="strick slip",
    x=9.0,
    y=9.0,
)
fig.text(
    text="reverse",
    x=9.0,
    y=8.5,
)

fig.show()
# fig.savefig(fname="legend_meca_manuall.png")
output figure:
Even this is quite a long answer, I feel it is only limited satisfying. Maybe somebody else can help out with a simpler solution ![]() .
.
1 Like