Hi all,
I’m not sure what I’m doing wrong here, and some guidance would be very much appreciated!
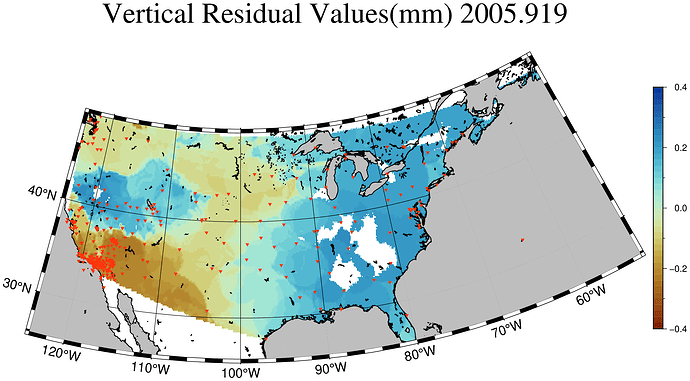
For context, I created a map previously that looks like the first image below. I ran it by my advisor for feedback and the feedback was the following:
- Don’t mask the grid over the ocean
- reverse the colorbar gradient and add a white “hinge” in the middle
- No minor lakes/rivers plotted
- No lat/lon grid
- triangles → circles
- Add state lines
- Make it such that the frame/projection does not change despite values
- The other iterations that had less coverage would shrink the boundaries
- re-run the values with a filter that excludes values less than 2sigma (I excluded values greater than 2sigma because I’m dumb)
I’ve checked most of those boxes off. And I have yet to confirm if the map frame/area will change as I’ve only created a single map of a single epoch so far.
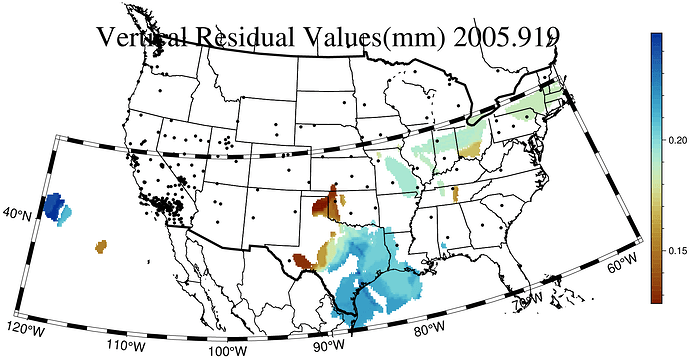
I keep running into this issue that is shown below. I’m thinking this might have to do with the region I specified in my code? Here is the code that produced the image below.
epoch1 = readdlm("/path/to/Documents/julia/twosigma/2005.919_2sigma.txt");

C = GMT.makecpt(cmap=:roma,
    range=(minimum(epoch1[:, 3]), maximum(epoch1[:, 3]), 0.002));

#imshow(C, B = :none, horizontal = false) # check increments of colorbar

G = GMT.gridit(epoch1[:, [1, 2, 3]], mask = 0.3, inc = 0.1);

GMT.grdimage(G,
    proj=(name = :lambertConic, center = [-100 35], parallels = [33 45]),
    coast = (region = [-130 -70 24 51],
        borders = ((type = 1, pen = ("thicker", "black")), (type = 2, pen = ("thinner", "black"))),
        shore = ((level =1, pen = (0.5, :black)))),
    frame=(annot=:a, ticks = :a),
    cmap=C,
    title = "Vertical Residual Values(mm) 2005.919",
    colorbar = true,
    fmt = :png,
);


GMT.scatter!(lonlat,
    marker = :c,
    markersize = 0.075,
    mc = "black",
    # figname = imgpath * "2005.919_2sig.png",
    show = true)
Are there any glaring errors or omissions? I’ve been reading through the frames documentation and have attempted various iterations of frames but the border always ends up super wonky. The region of region = [-130 -70 24 51] is the region I want to keep static, but it doesn’t appear that it is being read in?
The variations of frame that i’ve tried are:
#1
frame=(axes=(:left_full,:bottom_full,:right_full,:top_full), annot=:a,
               ticks=:a)

#2
frame = :S

#3
frame = :auto

#4
frame = (axes=(:left_full,:bottom_full,:right_full,:top_full), annot=:a,
                ticks=:a)

#5
frame = :afg  #and :af, :ag, :gf just to see what changed they made
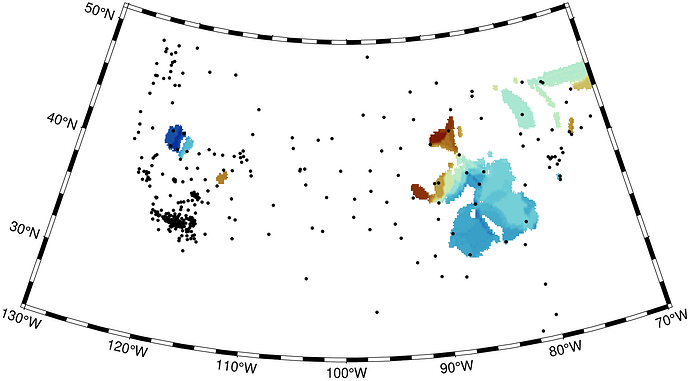
I’ve tried to further remedy this by starting using the GMT.coast operation first, and then lay the GMT.grdimage over it, but, that didn’t work either.
Again, thank you for any help and insights anyone has to helping me fix this problem. Also, I know the :roma cpt here doesn’t make much sense with all positive values for this particular epoch, but, it will look better once I get around to animating all my plots that have a much wider variation of values that are both negative and positive, which is the next step.
I’ve attached the text file I’m working with as well, in case anyone would like to run the code above.
2005.919_2sigma.txt (80.2 KB)
==============================================================
Final Edit:
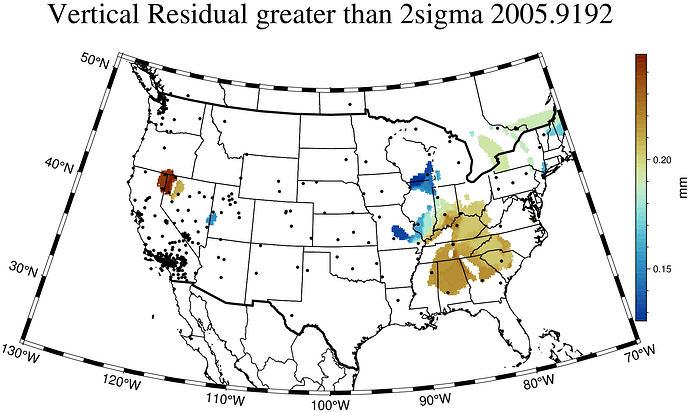
Okay, I got it to, at least, a somewhat acceptable form. Thank you Joaquim for your help, it definitely put me on the right path.
If anyone is interested, this is what my code ended up looking like:
epoch1 = gmtread("/home/rob/Documents/julia/twosigma/2005.919_2sigma.txt") # change to desired file


# value for cpt in epoch1[:, 3]
C = GMT.makecpt(cmap=:roma,
    range=(minimum(epoch1[:, 3]), maximum(epoch1[:, 3]), 0.002),
    reverse = true
);
#imshow(C, B = :none, horizontal = false) # check increments of colorbar

G = GMT.gridit(epoch1[:, [1, 2, 3]], mask = 0.3, inc = 0.1);

GMT.grdimage(G, region = [-130 -70 24 51],
    proj = (name = :lambertConic, center = [-100 35], parallels = [33 45]),
    cmap = C,
    colorbar = (pos = (outside = true, anchor = :MR, offset = (0, .9)), xlabel = "mm"),
    coast = (borders = ((type = 1, pen = ("thicker", "black")), (type = 2, pen = ("thinner", "black"))),
        shore = ((level = 1, pen = (0.5, :black)))),
    title = "Vertical Residual 2005.9192"
);

GMT.scatter!(lonlat,
    marker = :c,
    markersize = 0.075,
    mc = "black",
    figname = imgpath * "2005.919_2sig.png",
    show = true
);
The only think I need to tweak is the boarders in the coast module. As you can see the Great Lakes are not outlined in this iteration. But, that’s something I can figure out later. This is a good baseline for future implementations for my research.
One thing that took me way too long to figure out is that when creating the title, you cannot input special characters like σ or >. GMT will throw an error. I’m sure there is a way to input those types of characters, but, like the Great Lakes, that’s something I can sort out later.


