I’m trying out the new project module and wanted to use it to generate coordinates along a projection line, defined by a center, azimuth and length, so that I can plot the line. In GMT I would have done something like:
gmt project -C$Longitude/$Latitude -A$Azimuth -L-50/50 -Q -G0.1 | gmt plot -W3p,-
Is this currently possible in PyGMT? It seems the generate parameter won’t output xy values
Hi @FinniganIK, It should be possible to use pygmt.project generate the coordinates. Could you provide a sample Longitude/Latitude/Azimuth so that we can check that it works?
The PyGMT code would look something like so:
import pygmt

df = pygmt.project(center=[-50, 10], azimuth=45, length=[-50, 50], unit=True, generate=0.1)
where df is a pandas.DataFrame table with three columns like so:
              r          s     p
0    -50.322550   9.681888 -50.0
1    -50.321906   9.682525 -49.9
2    -50.321261   9.683161 -49.8
3    -50.320617   9.683798 -49.7
4    -50.319972   9.684434 -49.6
...         ...        ...   ...
996  -49.679406  10.315259  49.6
997  -49.678759  10.315895  49.7
998  -49.678112  10.316530  49.8
999  -49.677465  10.317165  49.9
1000 -49.676818  10.317800  50.0

[1001 rows x 3 columns]
You’ll then be able to plot the points. The x and y coordinates are the r and s columns respectively.
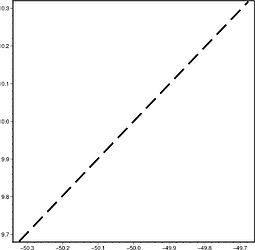
fig = pygmt.Figure()
fig.plot(x=df.r, y=df.s, pen="3p,-", frame=True)
fig.show()
produces:
P.S. @mgrund is just finishing up a new gallery example for pygmt.project at Generate points along great circles — PyGMT, so you can refer to that too
1 Like
Hey @weiji14. That works great! Thank you 
1 Like

