Hello,
I have a csv file with: latitude, longitude, geoid_height
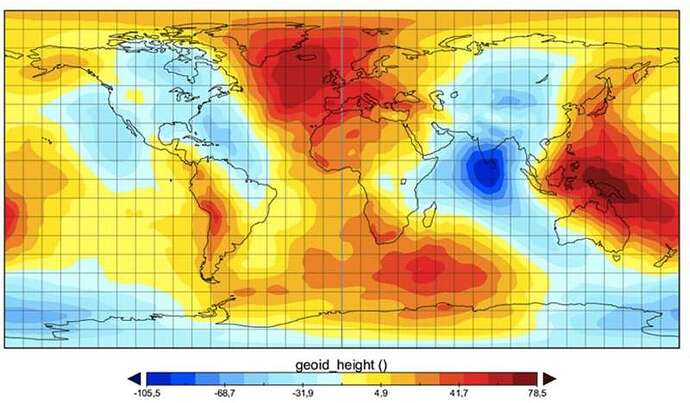
I have troubles finding a solution for how I can plot a map showing the geoid height for earth (or any location really) as a “heat map” Is there any good resources (examples or videos) of how i can do this?
I tried searching for a while, but did not find what I was looking for 
Appreciate the help
Hi @gis_sebb!! Welcome to the GMT Forum!!
What type of map do you want to make? If you want a heat-map type, then in this forum there are many posts.
1 Like
Thanks for the reply @Esteban82 ![]()
I was thinking something like this.
I was searching in the forum, but did not find something similar. Maybe I have not looked enough or for the right topic (?)
Maybe drop the name heat map. That’s not something we use around here. Search for grdimage. There are lots of examples. But to start with you need a grid with the data (not a heat  )
)
1 Like
@Joaquim Yeah that makes more sense, heatmap is definitely not the right term, hehe!
grdimage is probably what i need! I will look for that, thanks
