Dear all,
awk '{if (NR >=1) print $2,$1}' Ftunari.txt | psxy -JM -R -Sf0.3/0.2p+l+t -W1.3,red -O -K >> $archi
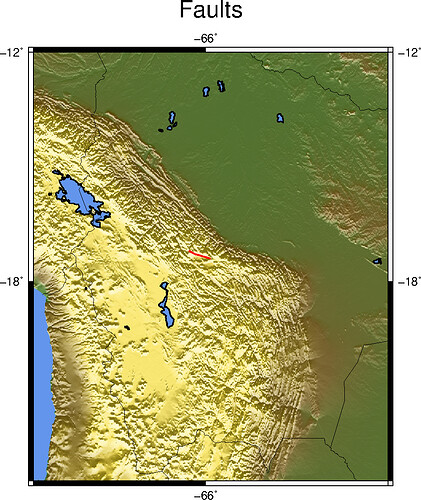
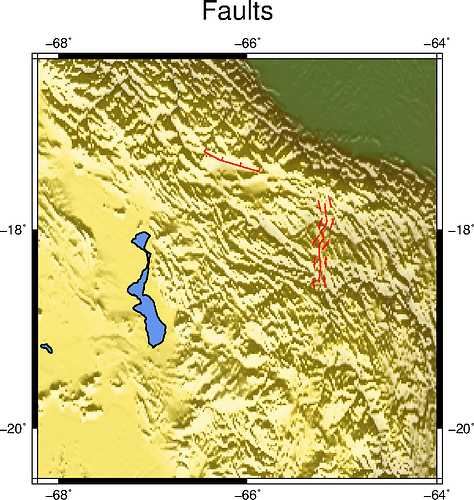
However I just see a line and not the triangles over the dashed line (attach the figure in jpg file), would you mind to correct me.
Not tried to run your code but the gap as well as the size look awfully small to me. 0.3 is missing a unit and 0.2p for size is tiny. Maybe it just gets eaten by the 1.3 (points I presume) wide line? You’ll need a symbol size which is larger than 1/2 line width to be seen at all. So everything larger than 0.7p might be noticeable.
Dear @KristofKoch ,
region="-R-68.22/-64.00/-19.20/-16.27"
proy="-JM5i"
flags="-Xc -Yc -B3 -K -P -V"
pts="-Wthinnest -V"
archi="10_Fig2a_SC.ps"
psbasemap $region $proy $flags > $archi
pscoast $region $proy -B3 -B+t"Faults" -N1 -Df -W2/1 -Scornflowerblue -O -V -K >> $archi
awk '{if (NR >=1) print $2,$1}' Ftunari.txt | psxy -JM -R -Sf5i/5.5p+l+t -W0.25,red -O -K >> $archi
psxy  -R  -J   /dev/null -O  >> $archi
gv $archi &
The Ftunari.txt is:
lat lon
Thank you in advance.
Tonino,
Dear @RustyCuth ,
awk '{if (NR > 1) print $2,$1}' Ftunari.txt | psxy -JM -R -Sf0.25i/6.5p+l+f -W0.55,red -O -K
Thank you a lot.
No need to awk it. This can be simplified to
psxy Ftunari.txt -JM -R -Sf0.25i/6.5p+l+f -W0.55,red -h -: -O -K
Dear @Joaquim ,
Dear All,
region="-R-69.76/-62.81/-23.17/-13.0"
regionea="-R-68.8451/-67.4718/-16.889/-16.1095"
grdfile="MT_bedrock.grd"
proy="-JM5i"
proyea="-JM2i"
flags="-Xc -Yc -B2.5 -K -P -V"
flagsea="-X6.7c -Y15.85c -Bf -K -P -V"
pts="-Wthinnest -V"
color="GMT_relief.cpt"
archi="10_Fig2a_Bolfaults.ps"


psbasemap $region $proy $flags > $archi
grdgradient $grdfile -A180 -Ne0.7 -Gbol_MT.int
grdimage $grdfile $region -Ibol_MT.int $proy $flags -C$color -O -K -n+c>> $archi
pscoast $region $proy -B2.5 -B+t"Faults" -N1 -Df -W2/1 -Scornflowerblue -O -V -K >> $archi
awk '{if (NR > 1) print $2,$1}' Ftunari.txt | psxy -JM -R -Sf0.25i/8.5p+l+f -W1.3,red -O -K >> $archi

#another map inside the "big map"
#it is a small set of faults that are so near
grdimage $grdfile $regionea -Ibol_MT.int $proyea $flagsea -C$color -O -K -n+c>> $archi
pscoast $regionea $proyea -Bf -N1 -Df -W2/1  -X6.7c -Y15.85c -O -V -K >> $archi

#this is the attemp, but no draw
awk '{if (NR > 1) print $2,$1}' Fllojeta.txt | psxy -JM -R -Sf0.9/3.5p+l+f -W1.3,red -O -K -P >> $archi

psxy  -R  -J   /dev/null -O  >> $archi
gv $archi &
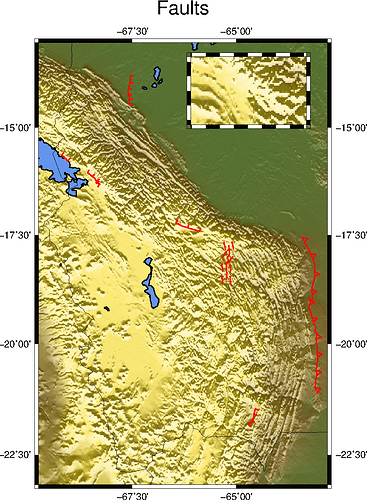
I am not able to plot a fault within the small map, do you have an idea, thank you a lot and stay safe.
Yuqiang
November 26, 2021, 6:53am
9
tonino13:
grdimage $grdfile $regionea -Ibol_MT.int $proyea $flagsea -C$color -O -K -n+c>> $archi
pscoast $regionea $proyea -Bf -N1 -Df -W2/1  -X6.7c -Y15.85c -O -V -K >> $archi

#this is the attemp, but no draw
awk '{if (NR > 1) print $2,$1}' Fllojeta.txt | psxy -JM -R -Sf0.9/3.5p+l+f -W1.3,red -O -K -P >> $archi
I think the -J and -R options in the first mapping command (i.e. your grdimage) are enough. You should remove the following -J and -R options.
1 Like
pwessel
November 26, 2021, 8:33am
10
If you used GMT 6 modern mode then you could use gmt inset to deal with the inset placement and scaling.
1 Like


